Release notes
Please refer to the changelog to see all the technical changes.
5.2.25
2026-06-30
Summary
New features
Improvements
New features
Database widget
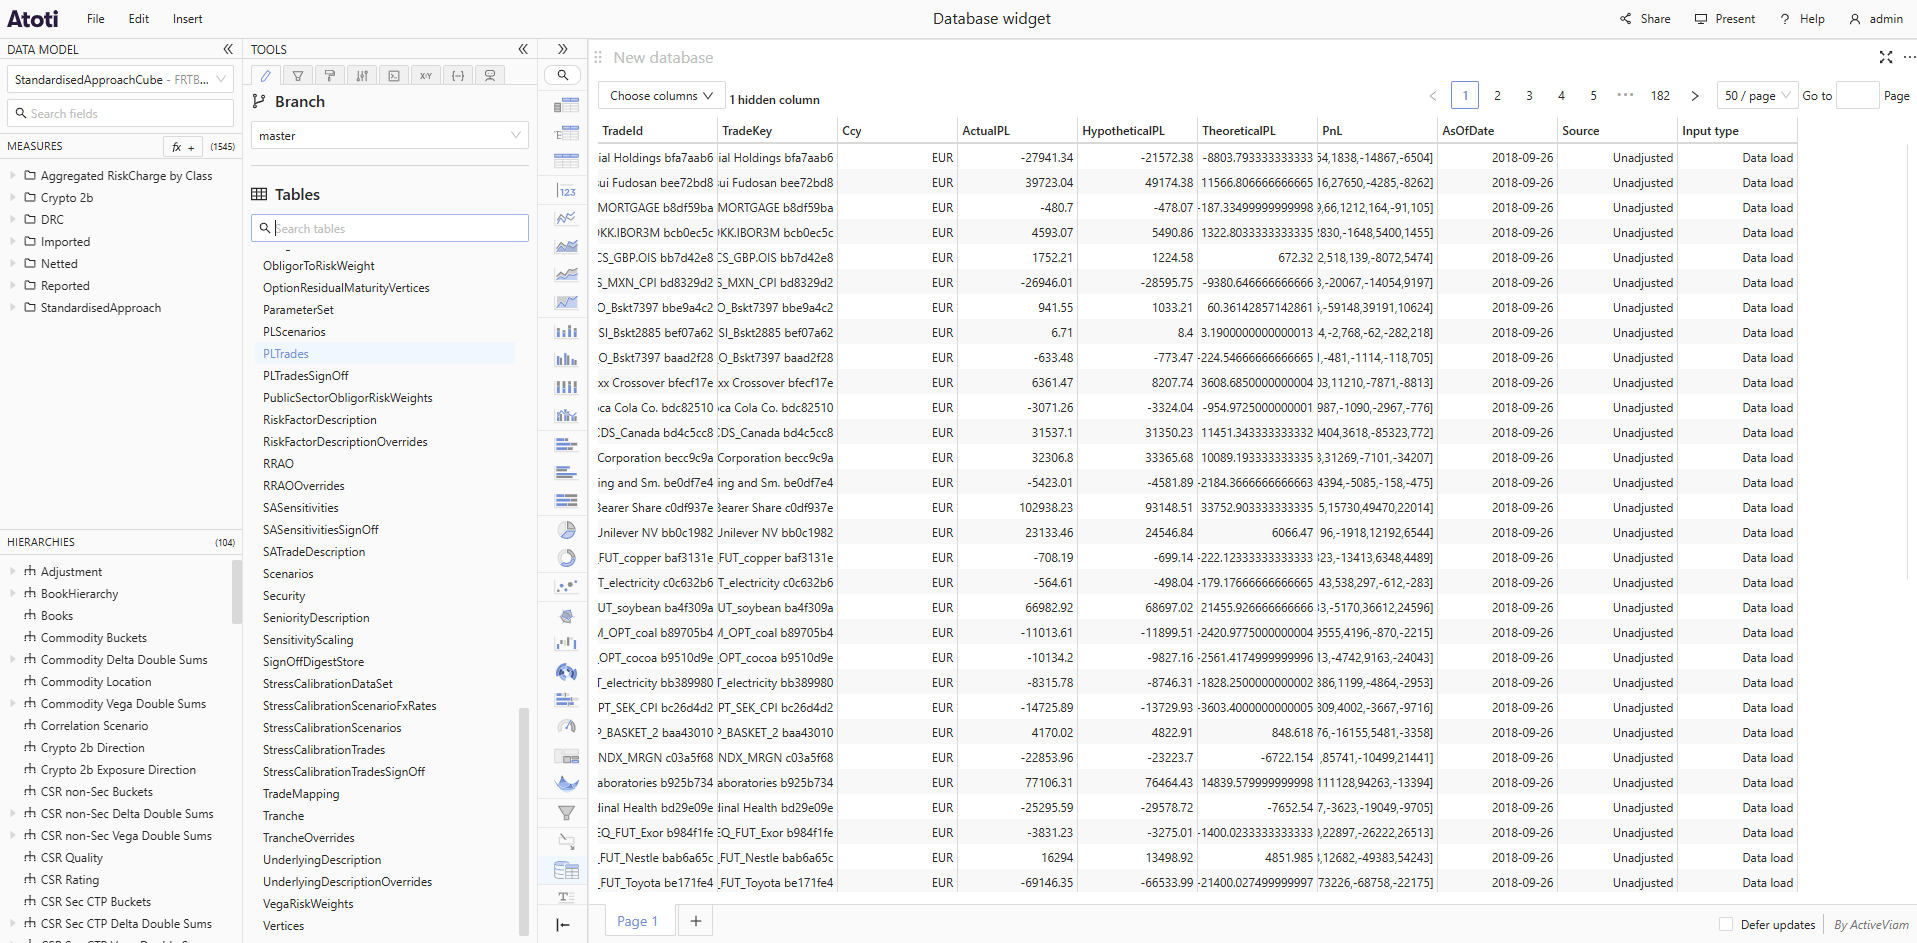
A new Database widget lets users browse the tables of an Atoti server's database directly from a dashboard, without leaving Atoti UI. Pick a branch and a table in the Fields tab, and the widget displays that table's rows. The grid supports paging, choosing which columns to show, resizing columns, sorting and filtering, searching tables and columns, and opening the vector viewer on vector cells.
Access to the widget is granted per role by an administrator through the widgets permission. For finer-grained control, database access control on the server lets administrators configure which database tables each user can access through the widget.
Improvements
Live status badge
The Live toggle in the application menu now displays a LIVE or PAUSED badge instead of a play or pause icon, making the current state easier to read at a glance. In a widget's title bar, the play or pause icon represents the action it performs — switching live updates on or off — rather than the current state.
5.2.24
2026-05-27
Summary
New features
Improvements
New features
Atoti Intelligence
Atoti Intelligence brings AI-assisted analysis directly into Atoti UI. It helps users build visualizations and understanding data through natural language, without prior knowledge on the software and the data model.
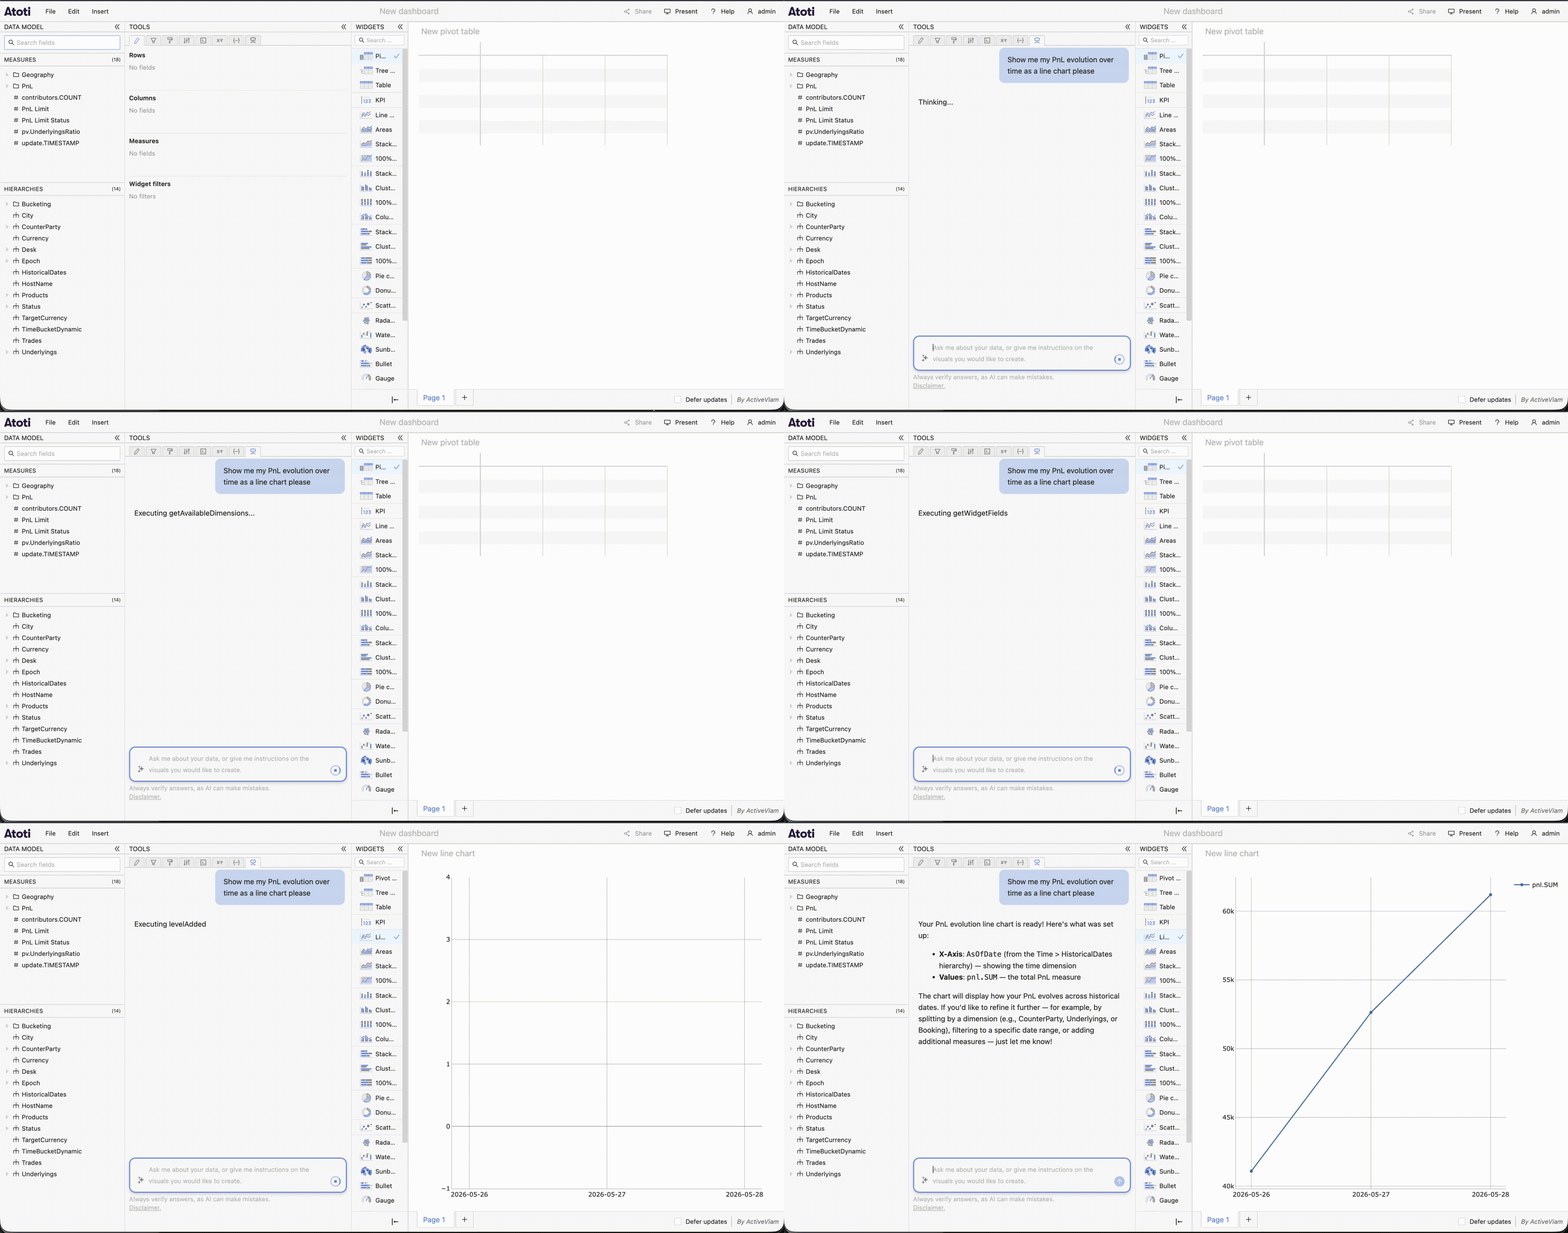
Describe the data visualization you want in plain English through the new AI assistant chat tool, and Atoti Intelligence builds it for you, ready to be used and interacted with within Atoti UI. Ask the assistant to help you explore, slice and dice your data.
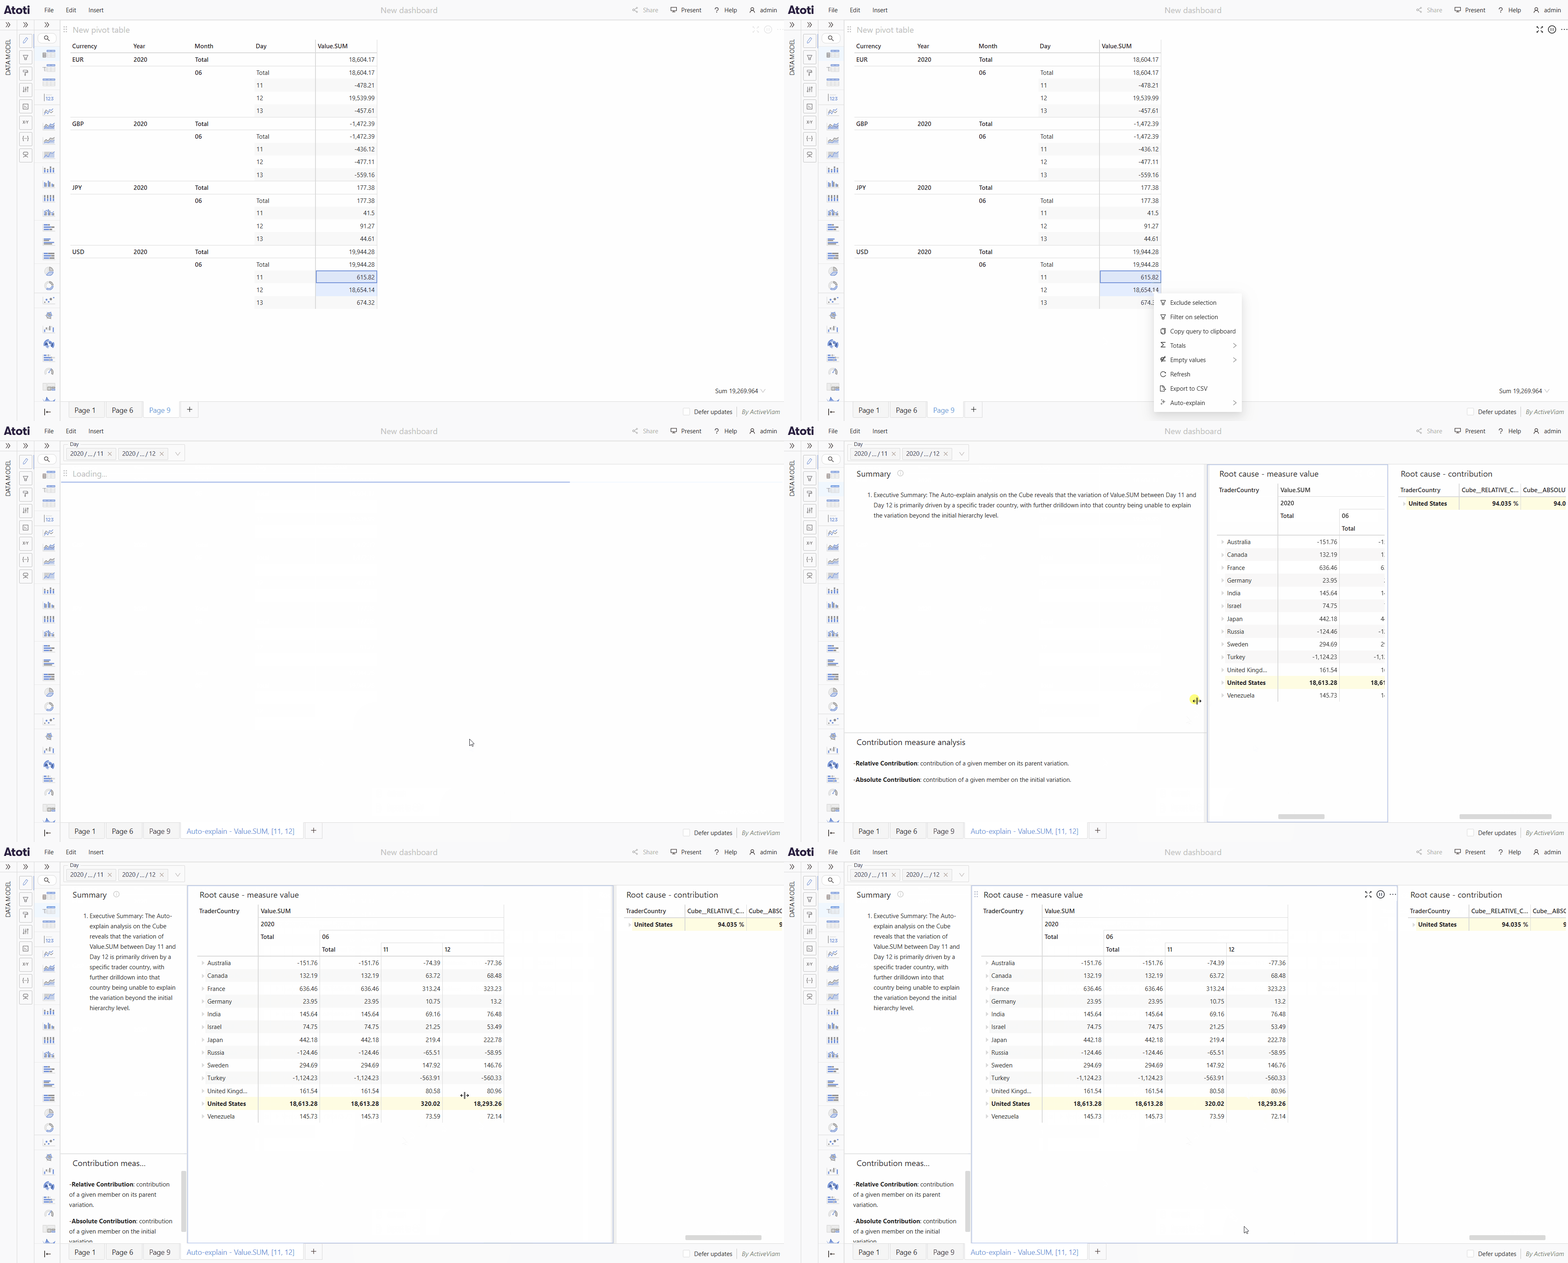
When some values look unusually different, e.g. the sales in 2025 vs 2026, Auto-explain can explain the difference automatically for you. Select two values in a table, right-click and select the Auto-explain menu item: Atoti Intelligence walks the data and identifies the paths which explain this difference. The result is presented as an Atoti UI dashboard page, with widgets highlighting these paths, and a plain-English summary.
Adding it in your project
Atoti Intelligence is shipped as an opt-in extension. Ask an admin to set it up in your project.
Seasonal pattern filter
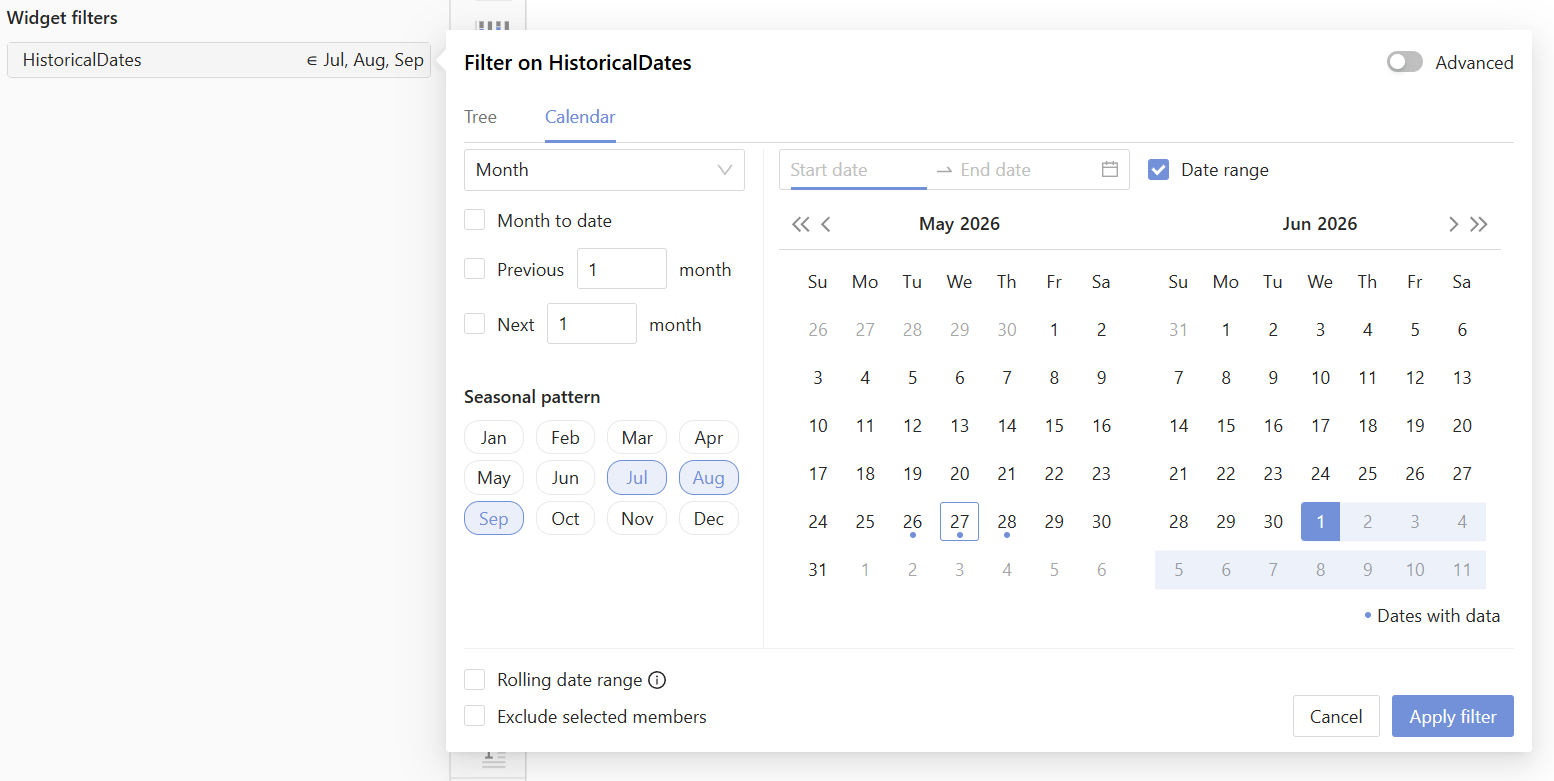
Date filters gain a Seasonal pattern mode, letting users filter on recurring calendar periods instead of explicit dates. In the Calendar tab of a date filter, switch the period to Day, Month, or Quarter, then pick the periods to keep — for example, every Mon and Wed, or every Q1. The calendar highlights all matching dates, and an Exclude selected periods option inverts the selection to filter those periods out instead.
Share dashboards with URL filters
A dashboard can be opened with pinned filters supplied through the URL, which are applied at load time. This makes it possible to share a single dashboard with specific filter values applied, instead of saving and distributing filtered copies. The dashboard opens marked as unsaved, so recipients can keep their own copy from File > Save as.
See Share dashboards with URL filters for the URL format and an encoding example.
Improvements
Focus cell shape
The Focus cell highlight shape is configurable through the new Focus cell shape setting: Row and column (default), Row only, or Column only. The shape can also be overridden per widget from the Behavior tab.
Live toggle
The Real-time toggle in the application menu and on widget titlebars is renamed to Live. Its icon shows a play when live updates are on and a pause when off, making the current state easier to identify at a glance.
Waterfall chart delta computation on time axes
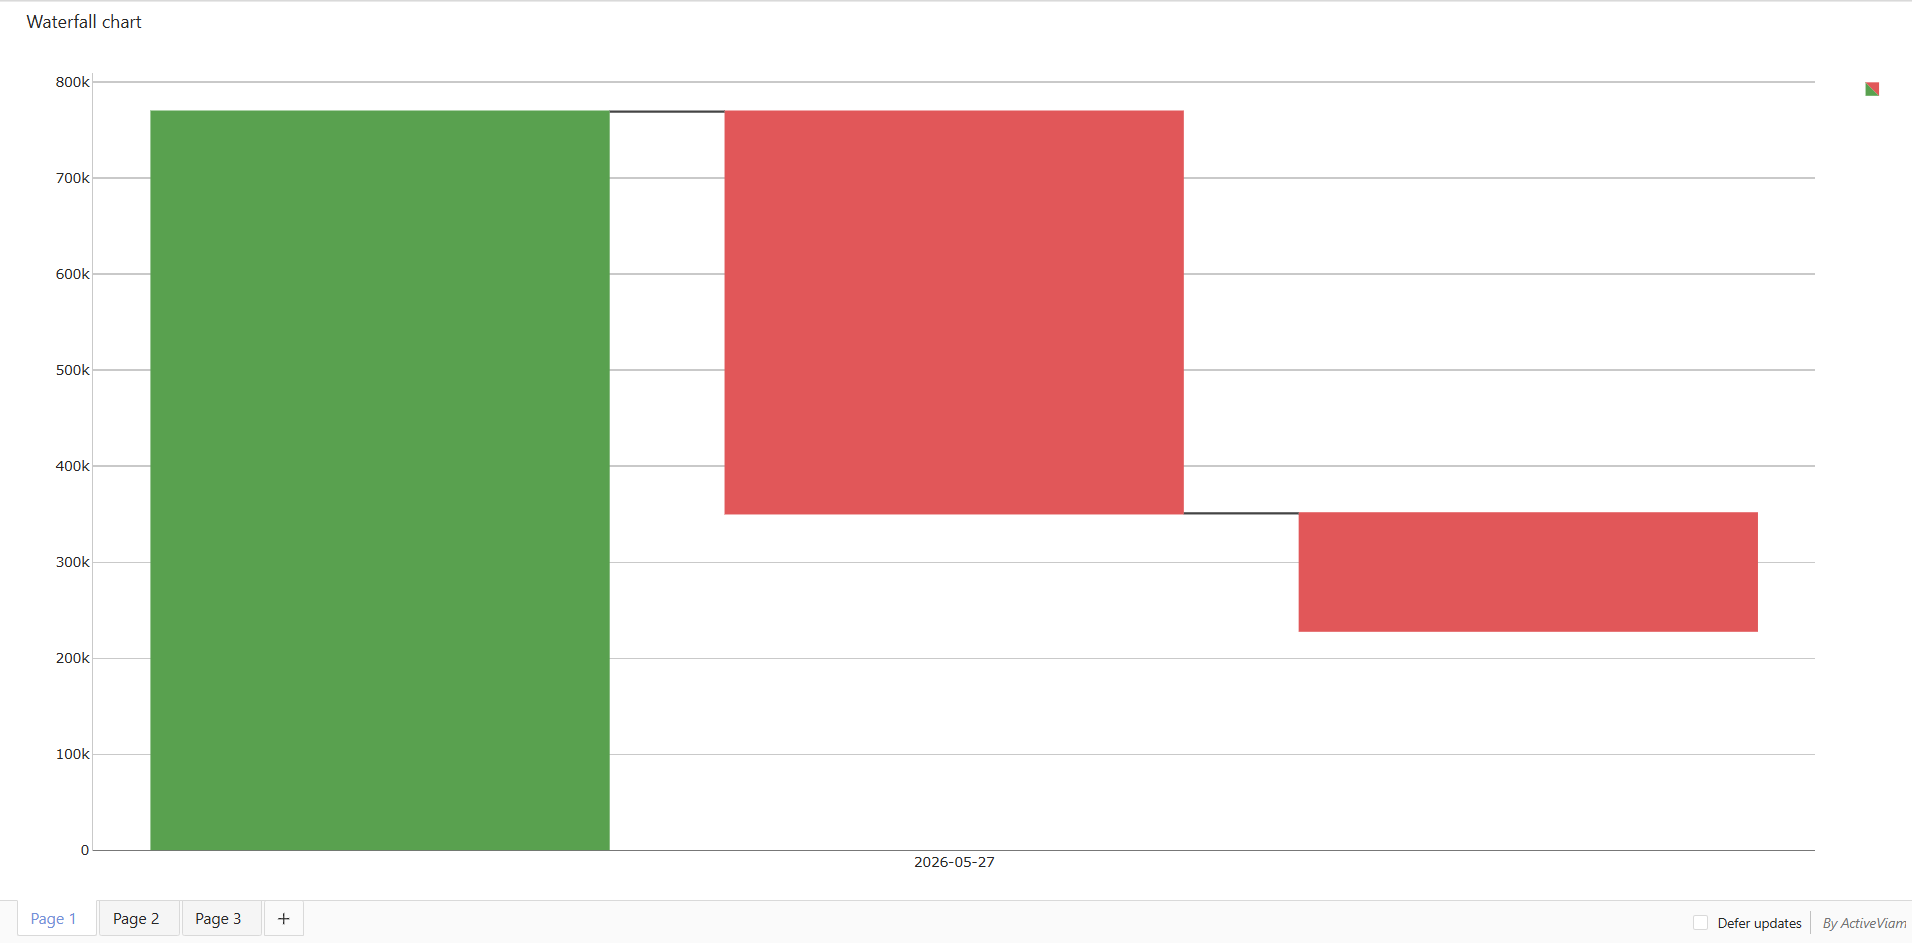
When the X axis of a waterfall chart uses a time level, the chart now computes and displays the change between each consecutive date rather than the raw values. The oldest date is shown as the absolute starting value, and each subsequent bar shows the gain or loss since the previous date. Date members are automatically sorted from oldest to newest so that the deltas always reflect the correct chronological direction, regardless of the order in which the server returns them.
5.2.23
2026-05-11
This release only contains maintenance updates. Refer to the changelog for the list of bug fixes.
5.2.22
2026-05-06
Summary
New features
New features
Shared with me
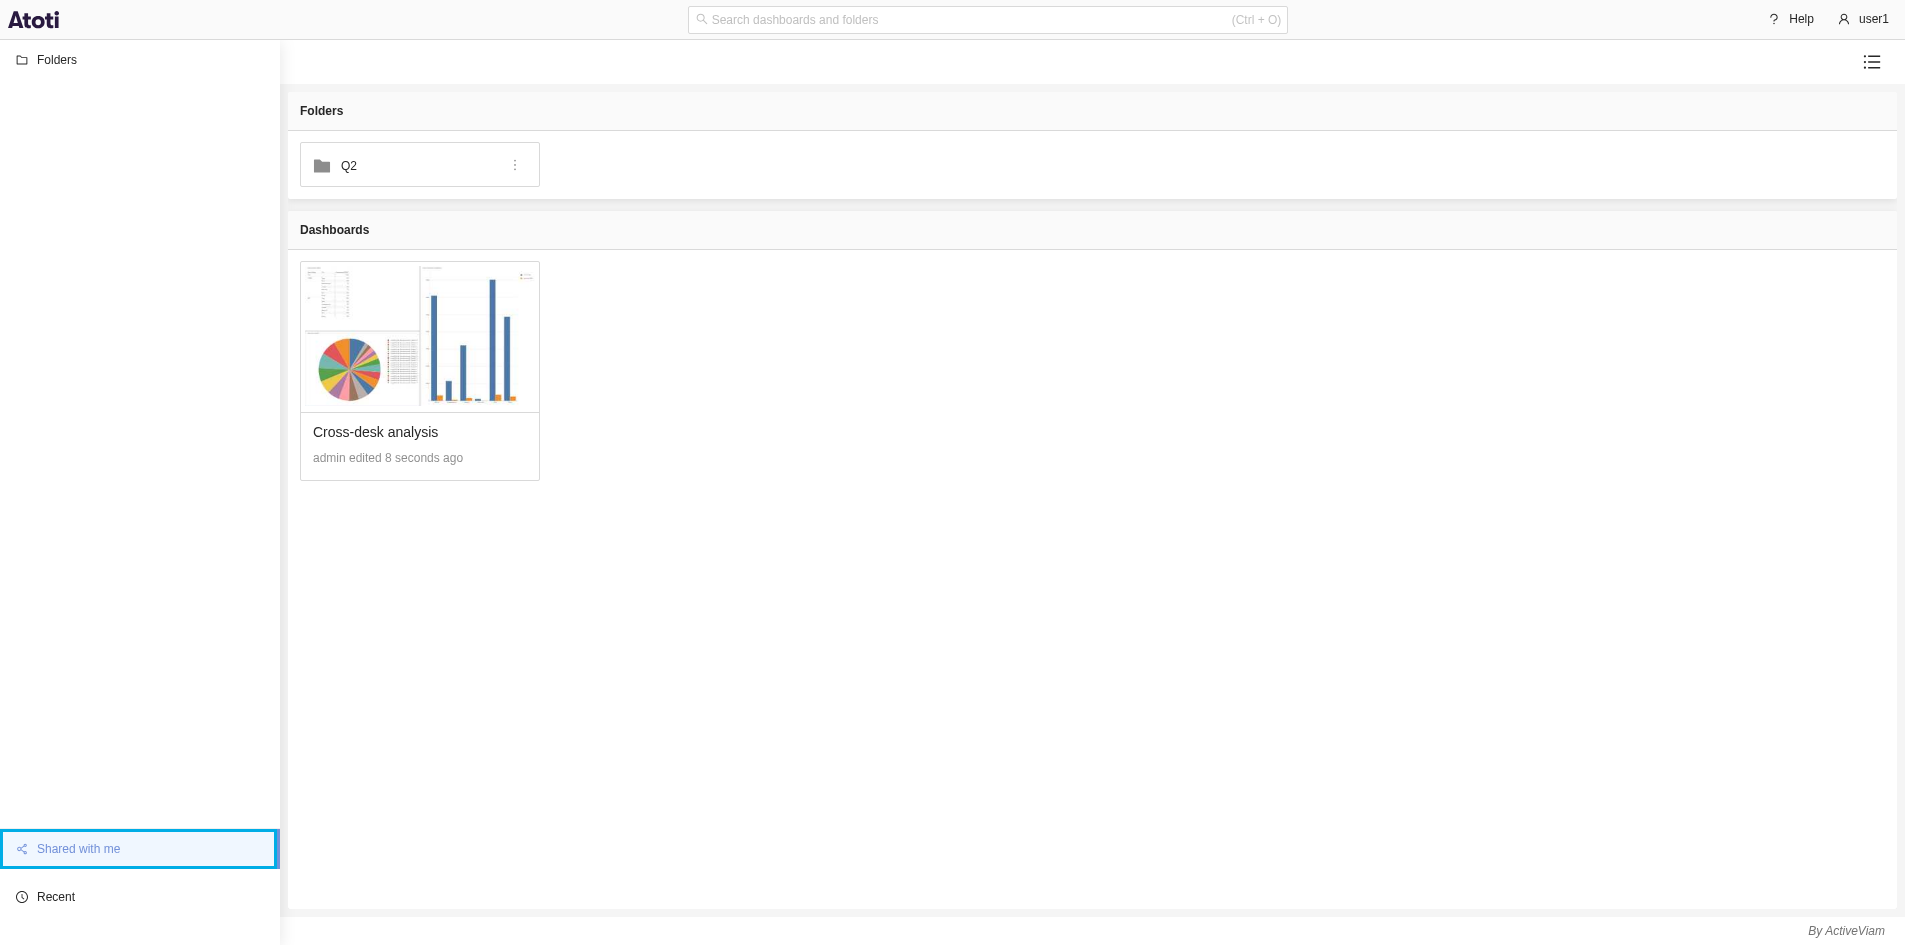
A new Shared with me section is available on the home page, where users can browse the folders and dashboards that other users have shared with them.
Format header cells by value
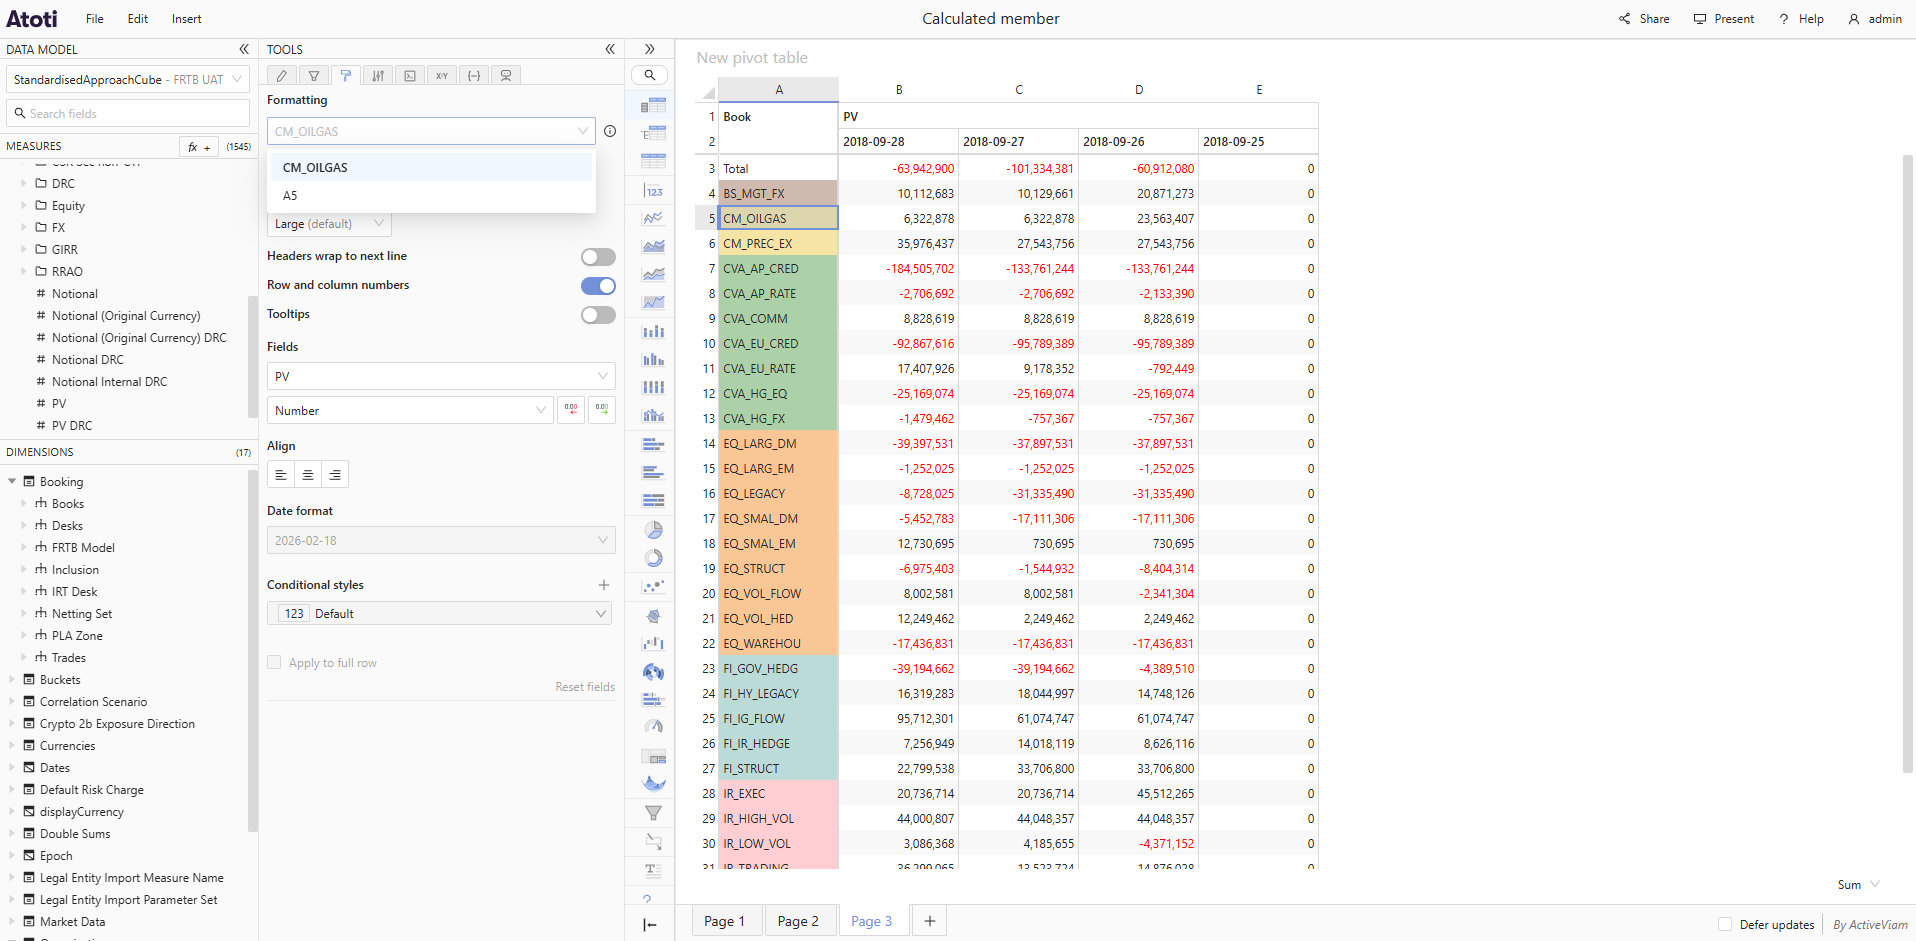
Formatting applied to a header cell follows the underlying member, instead of staying at a fixed position. For example, color the CM_OILGAS cell, then apply a filter that hides the book above. CM_OILGAS shifts up by one row, and its formatting follows.
5.2.21
2026-04-01
Summary
New features
Improvements
New features
Focus cell in tables
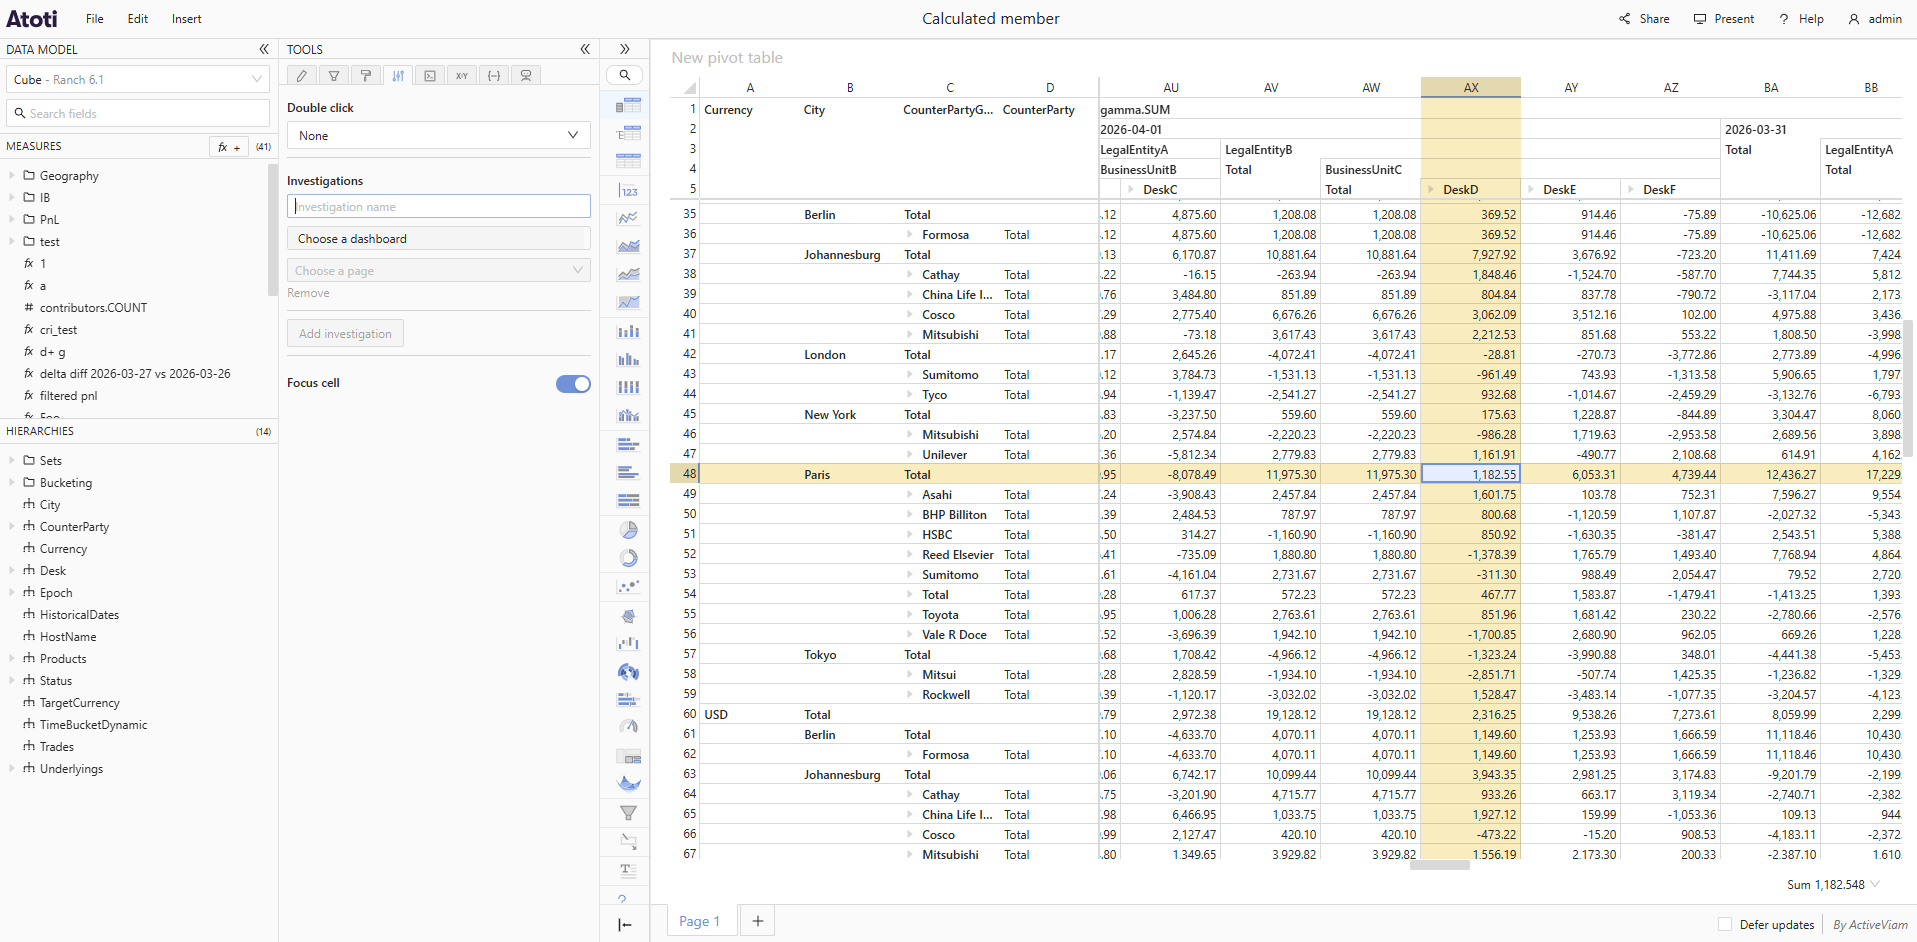
A new Focus cell toggle is available in the Behavior tab of Pivot Table, Tree Table and Table widgets. When enabled, hovering a cell highlights its full row and column, making it easier to read which row and column a cell belongs to. Clicking a cell pins the highlight on it, making comparing two cells simpler.
Improvements
Formatted CSV exports
CSV exports now reflect the number and date formatting configured in the Style tab.
Improved dark mode contrast
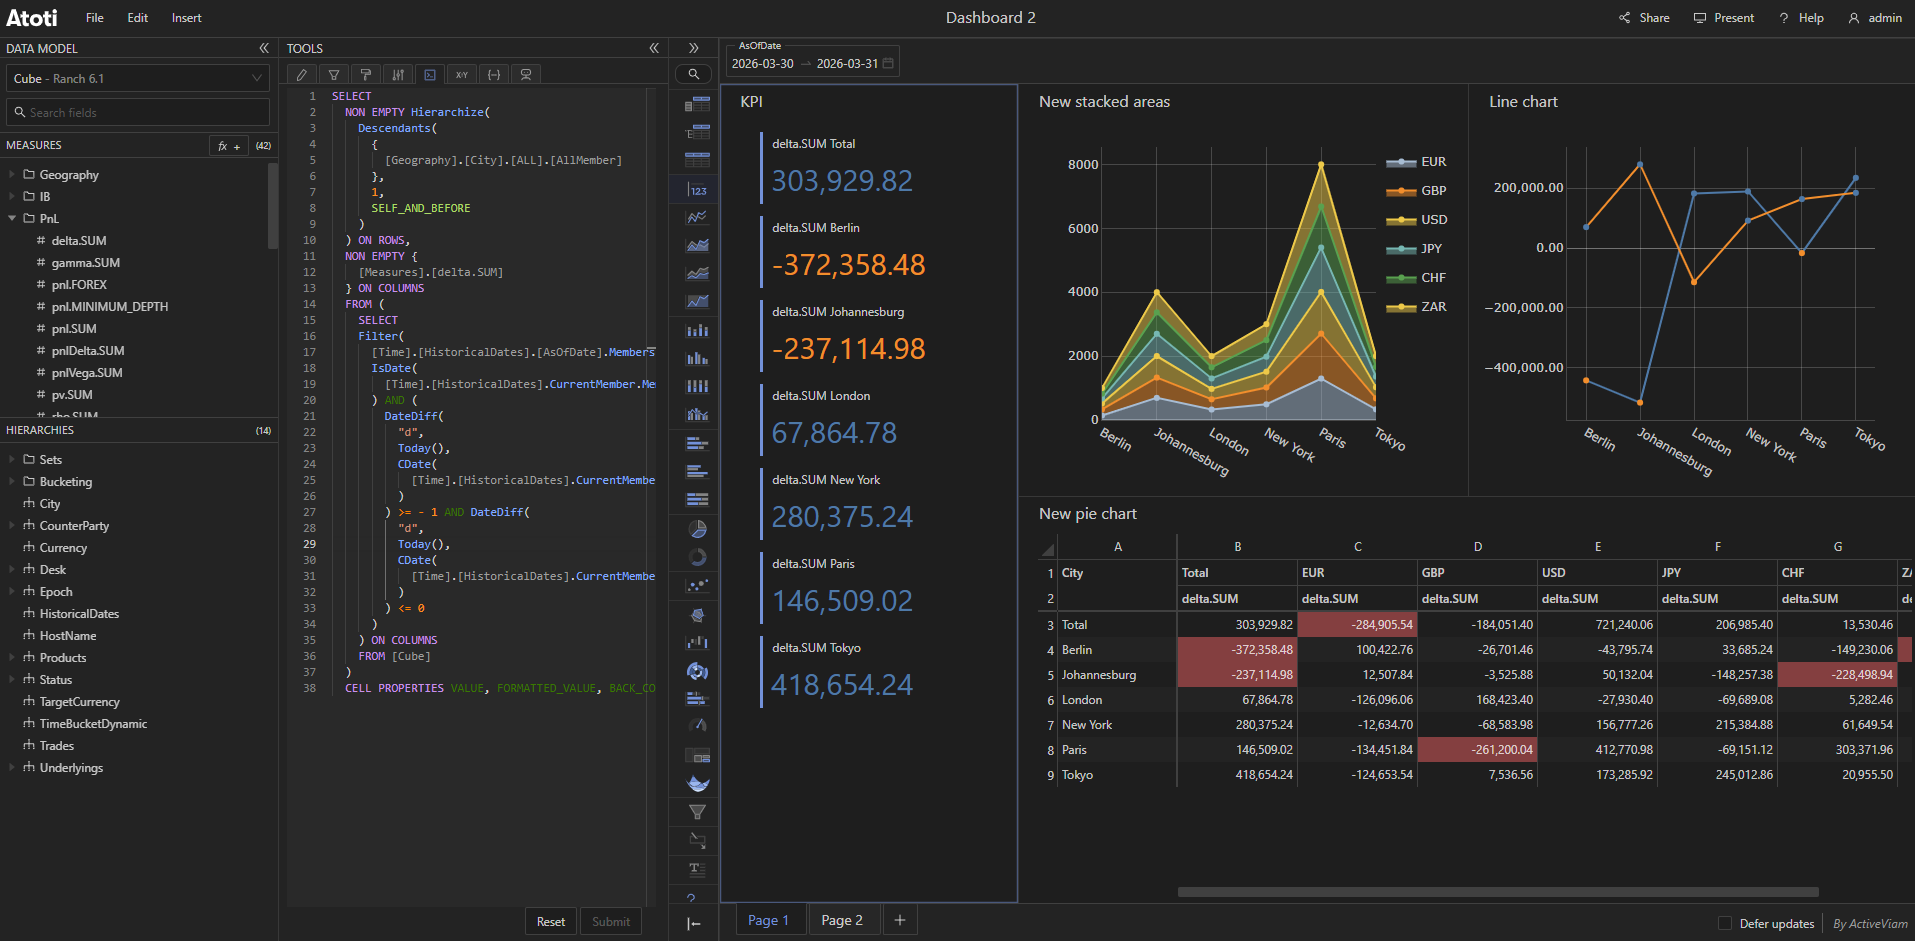
Dark mode has been updated with a darker background color, better text readability, and a theme-specific color palette with improved contrast for table cell backgrounds.
Navigate to folder from dashboards
When browsing inside a folder in the Open or Save as modals, a link next to the folder name lets you navigate directly to that folder.
5.2.20
2026-02-27
Summary
New features
New features
Format rows and columns in tables
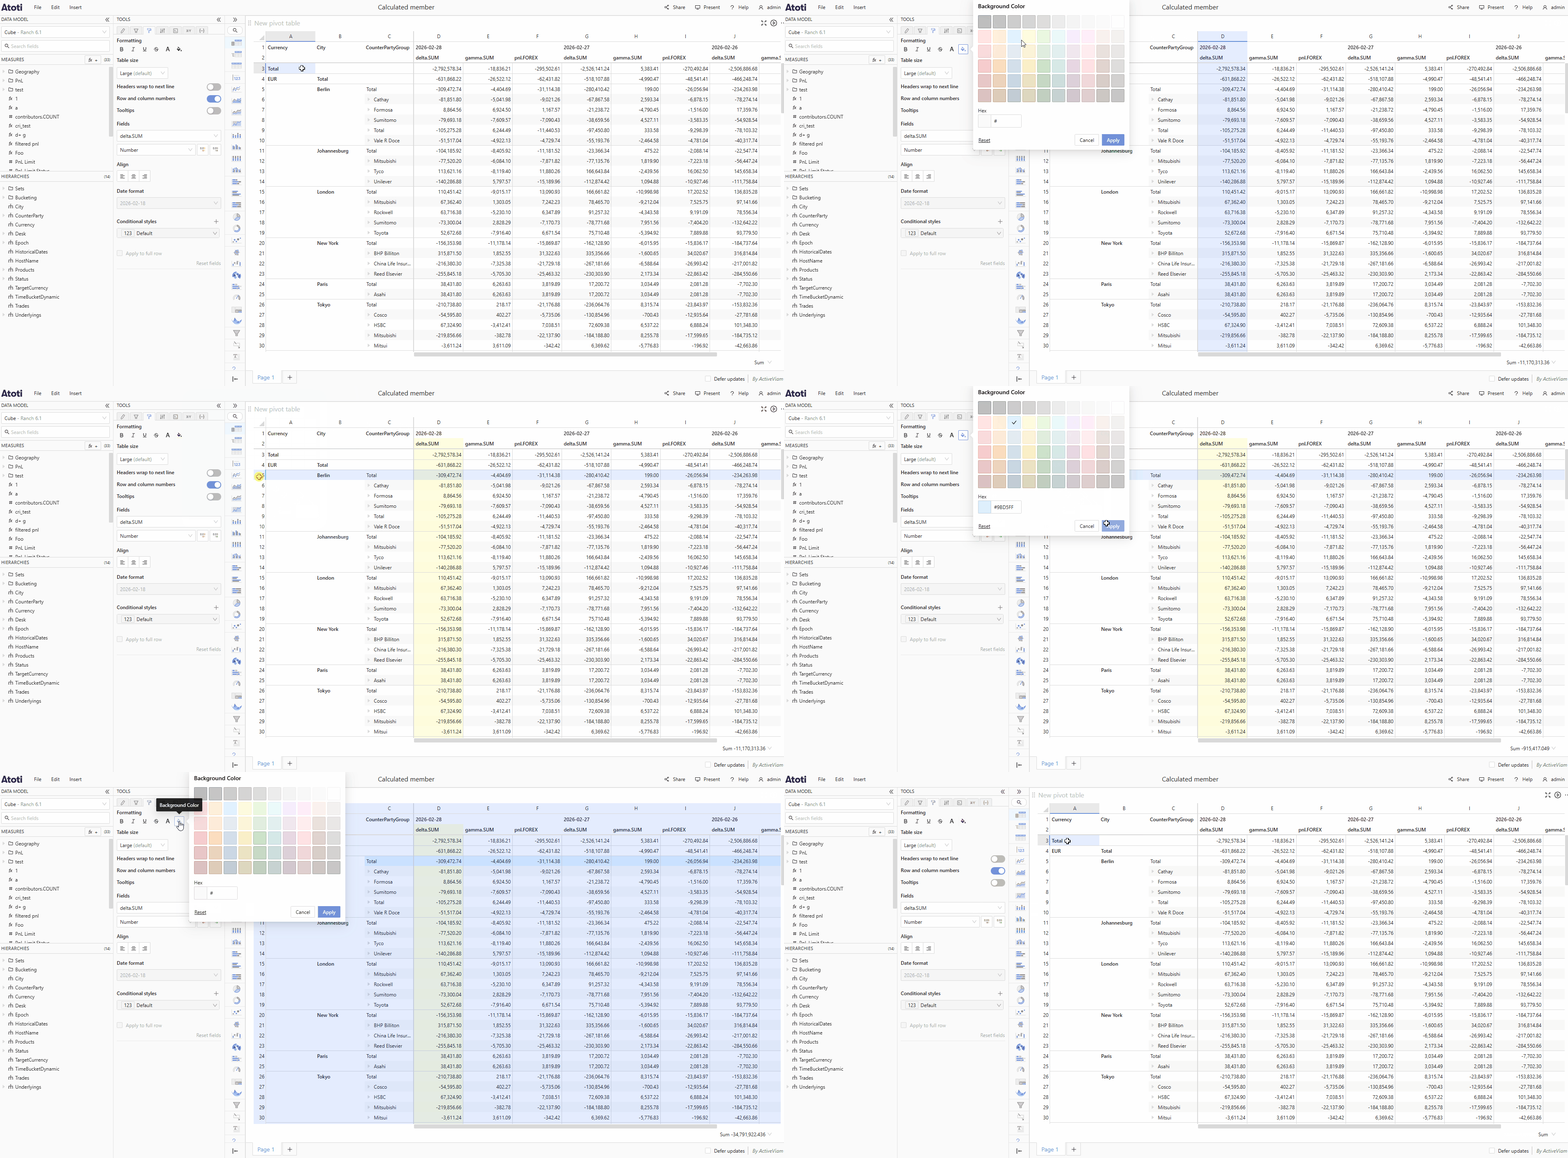
Users can format rows and columns in table widgets. The formatting controls are found in the Style tab and allow to format the selected cells. To format a row or a column, the user should select it by clicking its corresponding row or column number. Row and column numbers can be shown or hidden via a toggle, also in the Style tab.
Reorder members of a level on columns in table widgets
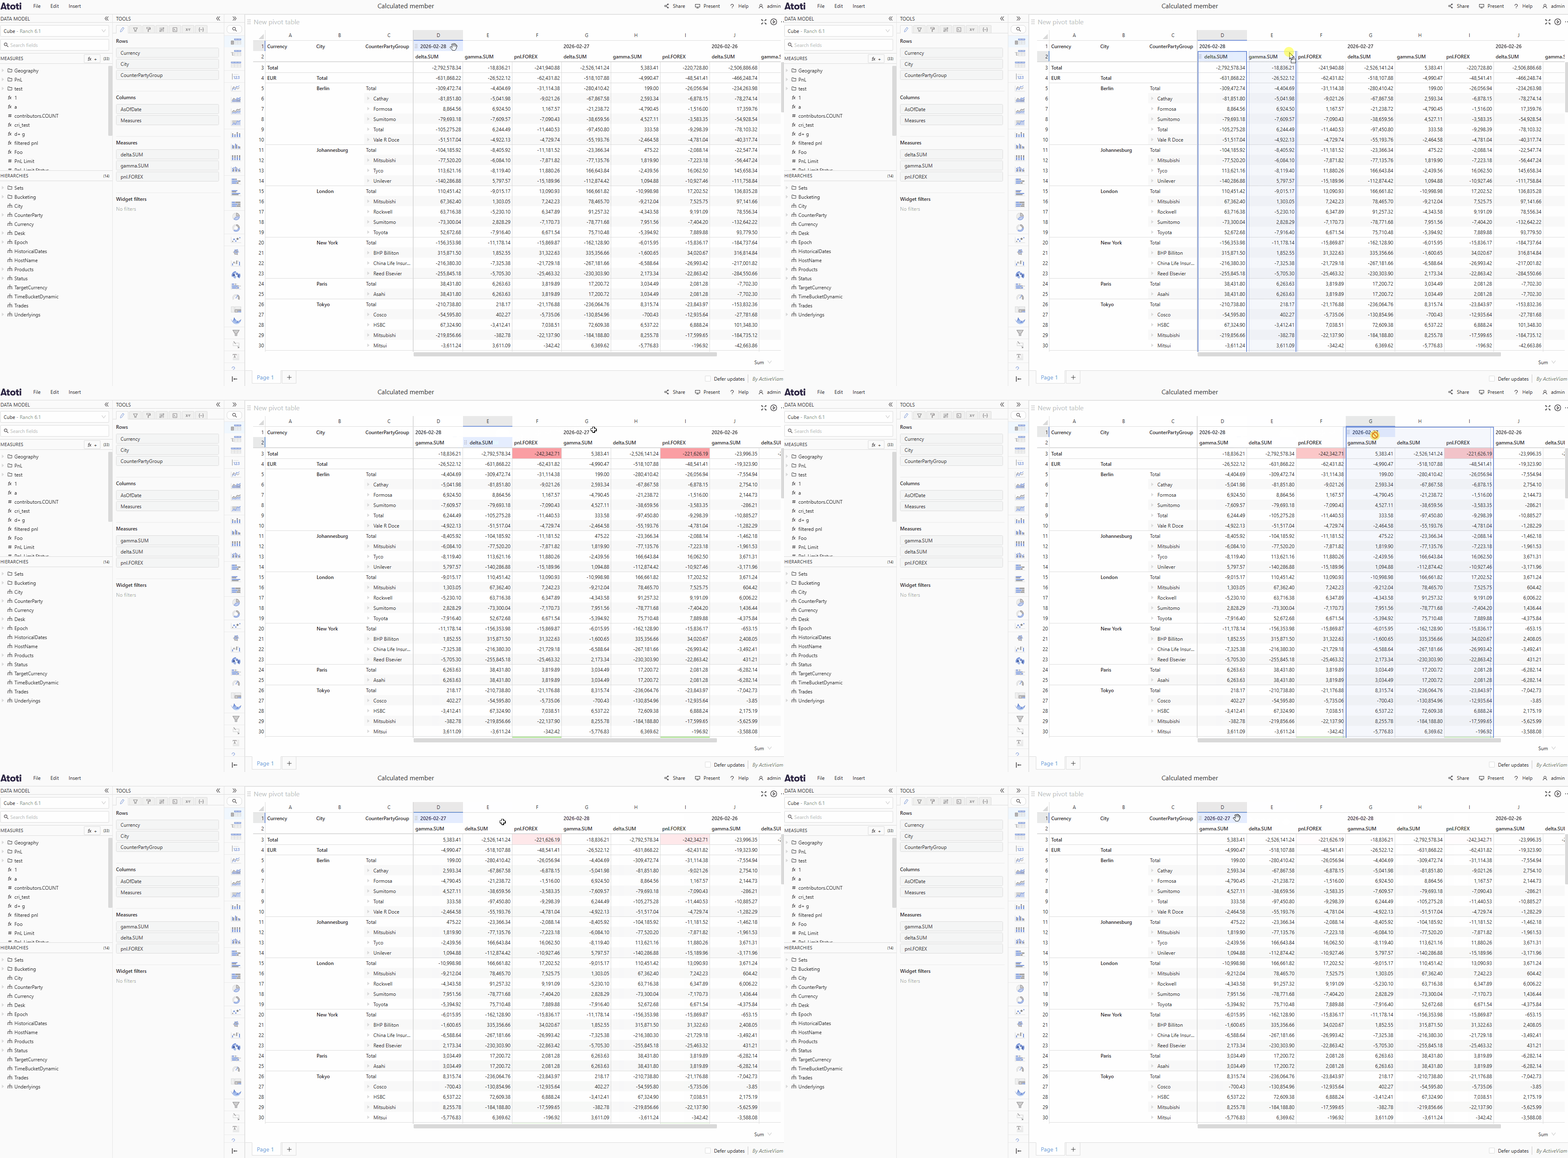
Users can reorder the members displayed on columns in table widgets, by drag and dropping them.
5.2.19
2026-01-30
Summary
Improvements
- Navigate between dashboard pages with keyboard shortcuts
- Search in measure group selector
- Saved widget information
- Save as shortcut on read-only dashboards
- Edit query-scoped calculated measures
Improvements
Navigate between dashboard pages with keyboard shortcuts
Navigate between dashboard pages using the Ctrl/Cmd + Alt + Page Up/Page Down keyboard shortcuts.
Search in measure group selector
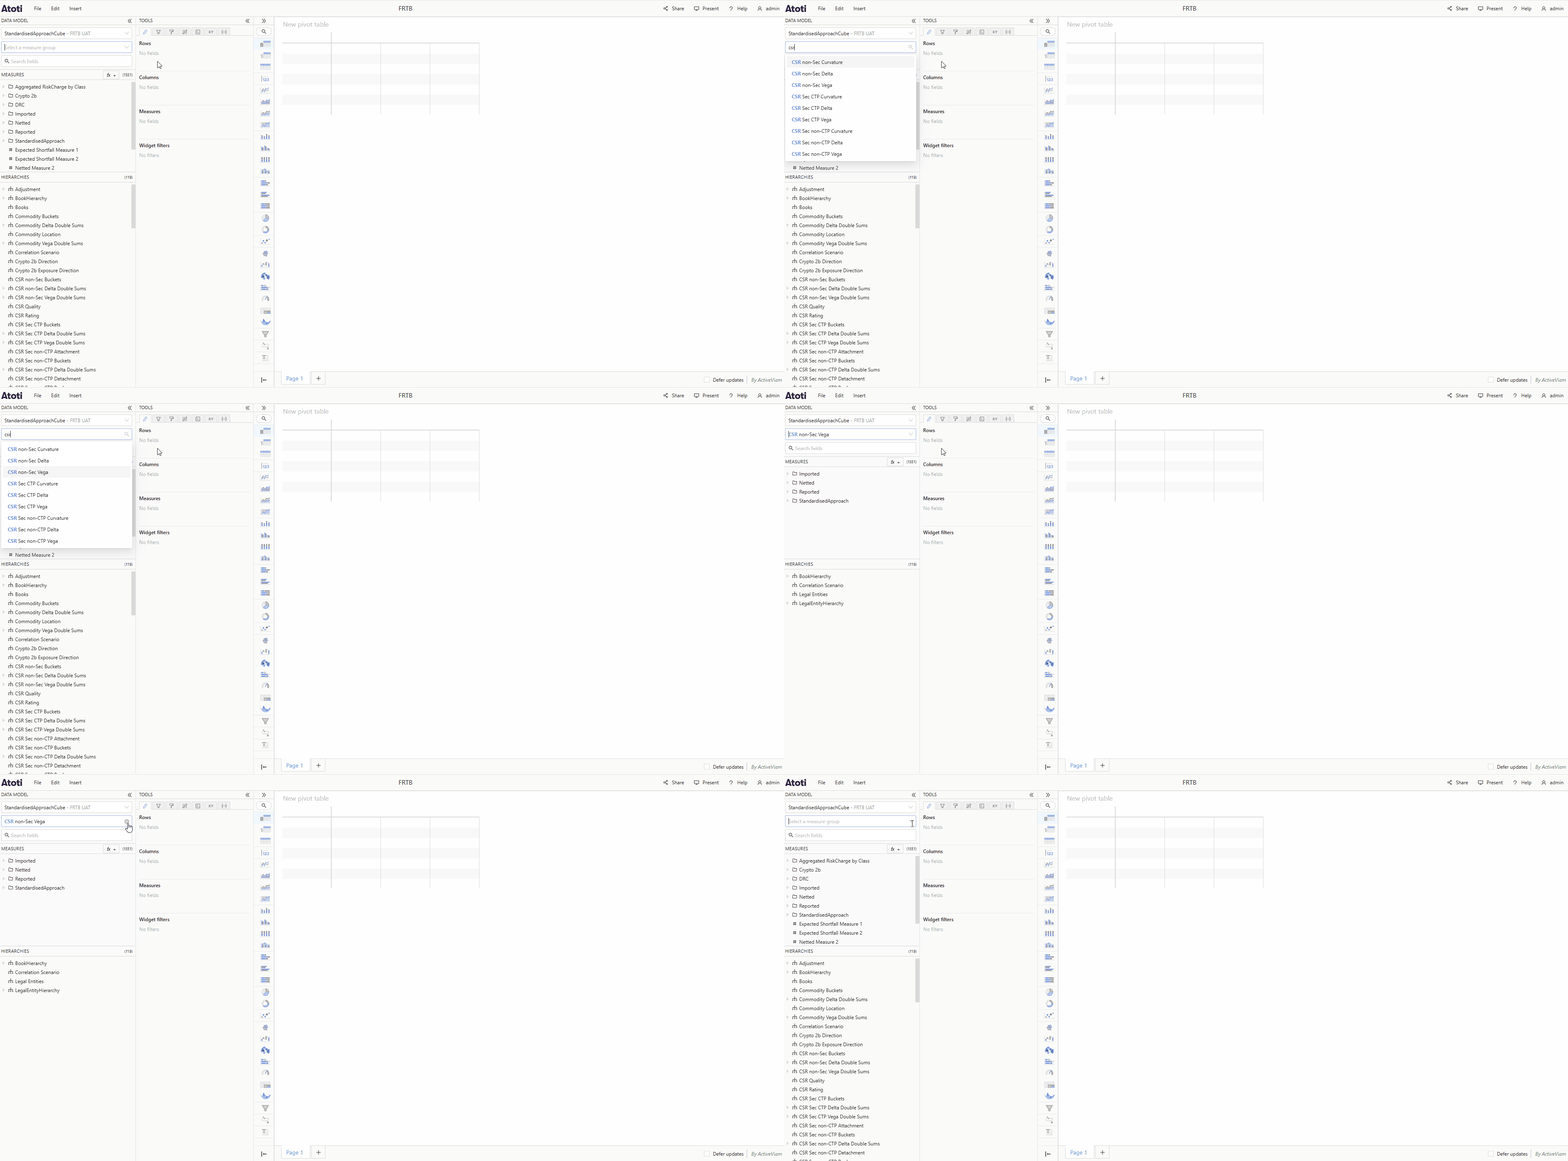
Search for measure groups by typing their names in the Measure group selector.
Saved widget information
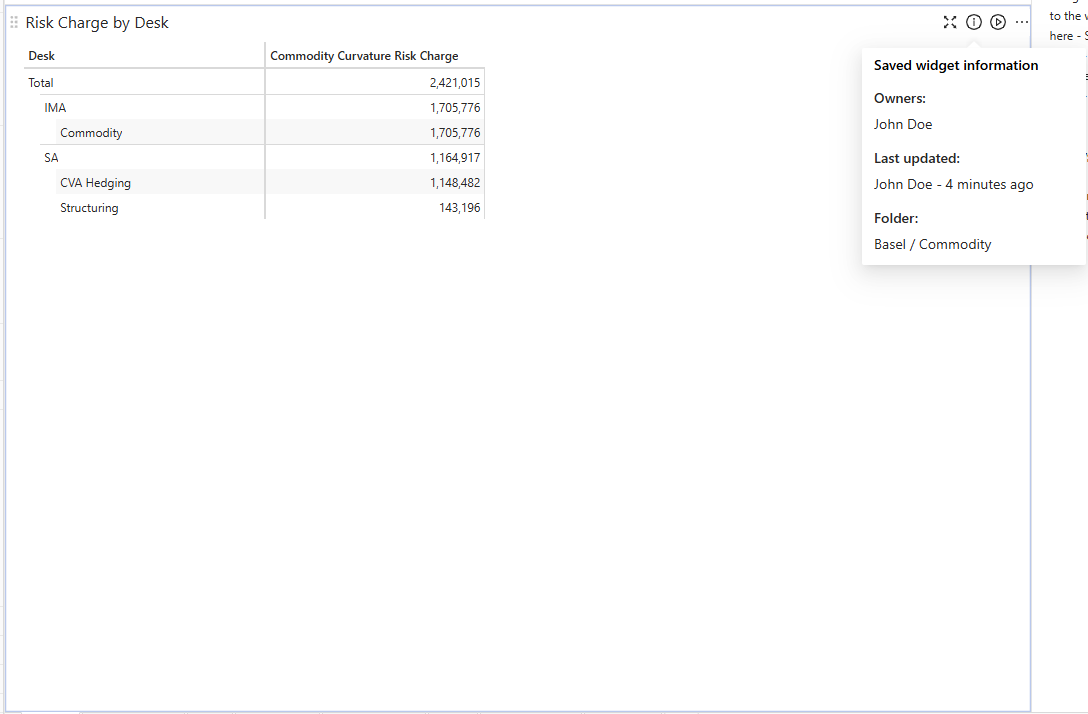
A new Saved Widget Information button is available in the titlebar of saved widgets. It displays the owners, last editor, last update time, and folder location of the saved widget.
Save as shortcut on read-only dashboards
Pressing Ctrl+S (or Cmd+S on Mac) on a read-only dashboard opens the Save As modal, allowing users to save their changes to a new dashboard.
Edit query-scoped calculated measures
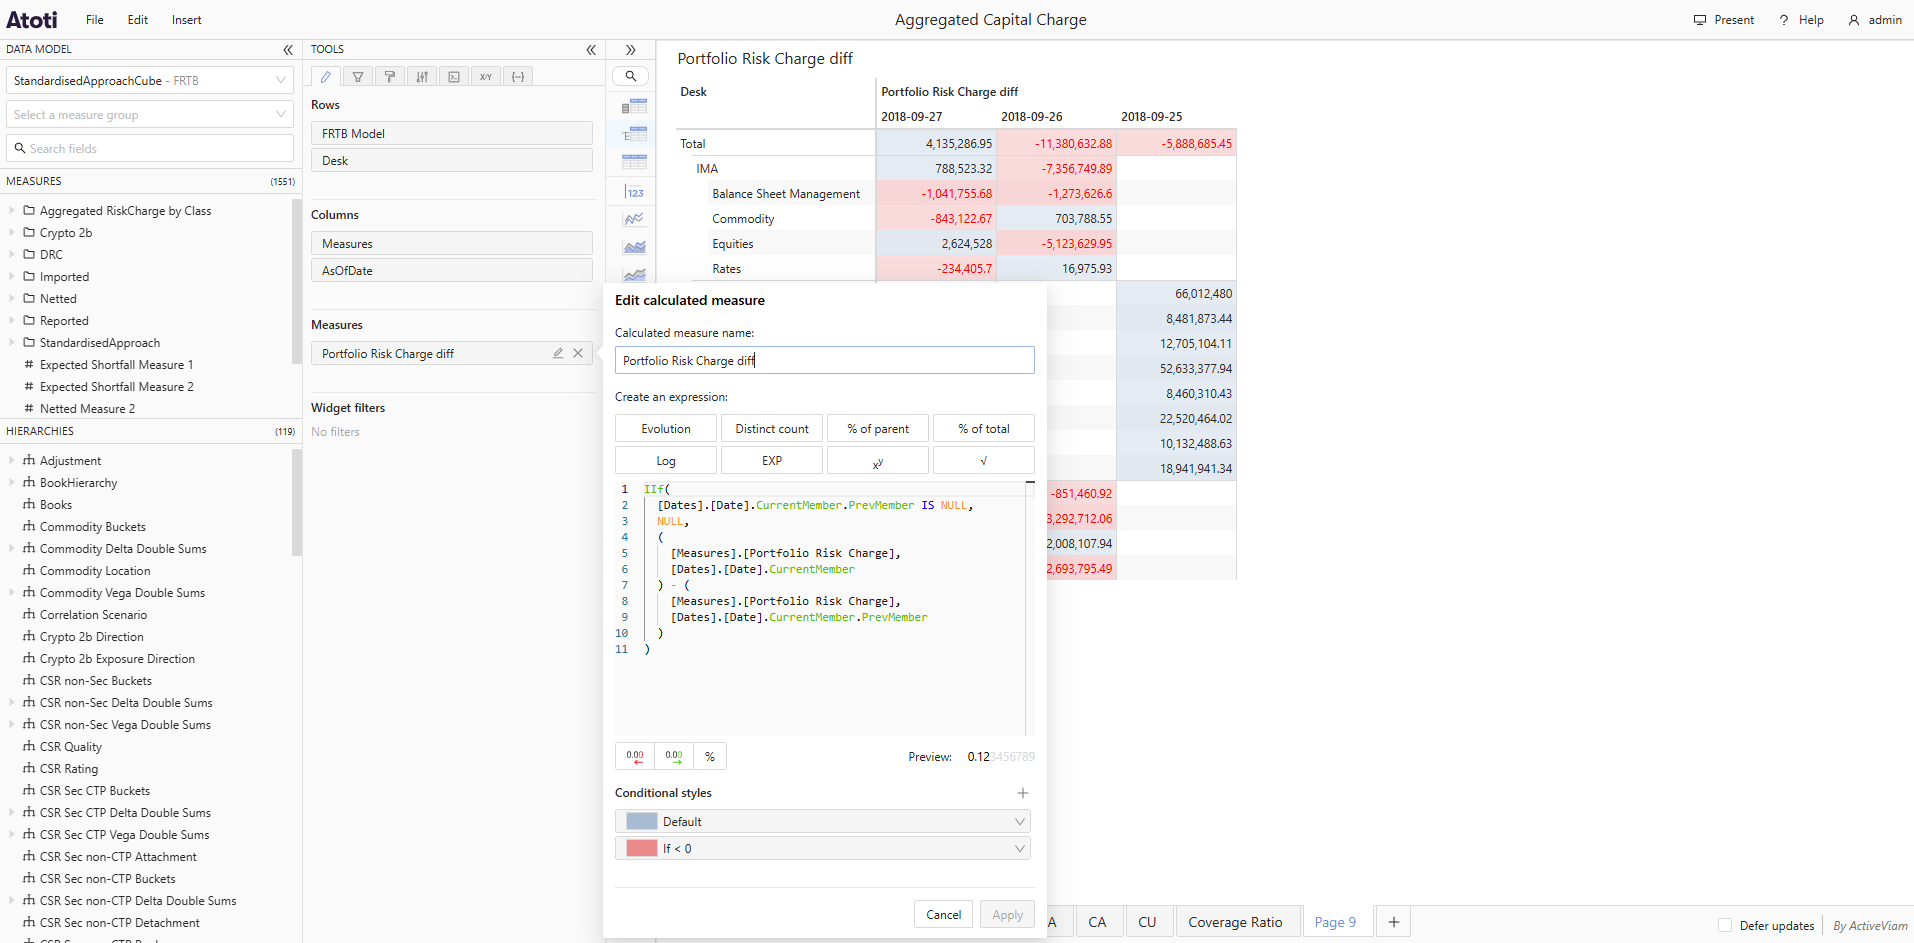
Edit query-scoped calculated measures directly from the Fields tab using the Edit calculated measure popover. This provides an easier way to modify such measures than the Query tab.
5.2.18
2025-12-31
Summary
Improvements
Improvements
Default selection mode for hierarchies
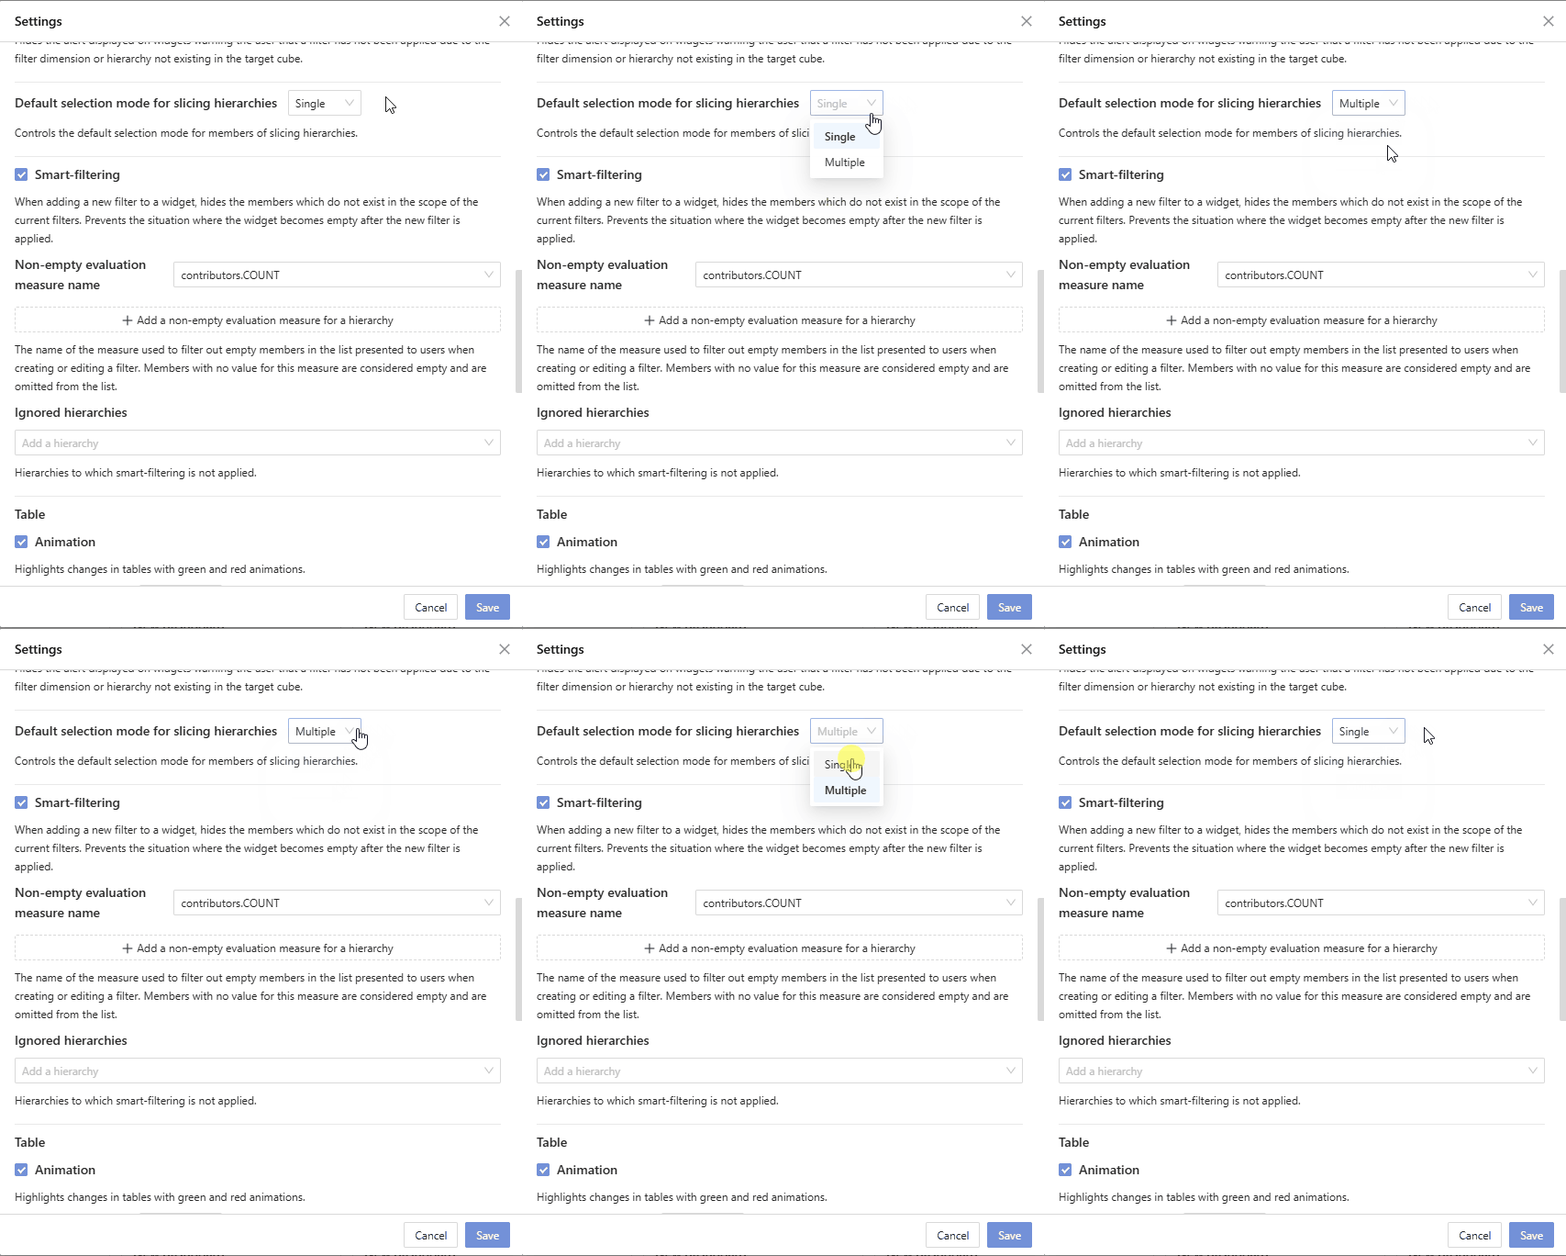
Users have a new setting where they can decide the default behavior for selecting members from slicing hierarchies when filtering. It can be set to be Single mode, where one can only have one member selected at a time, or Multiple where one can select multiple members by default. No matter which is selected, users can still change the mode in the popup.
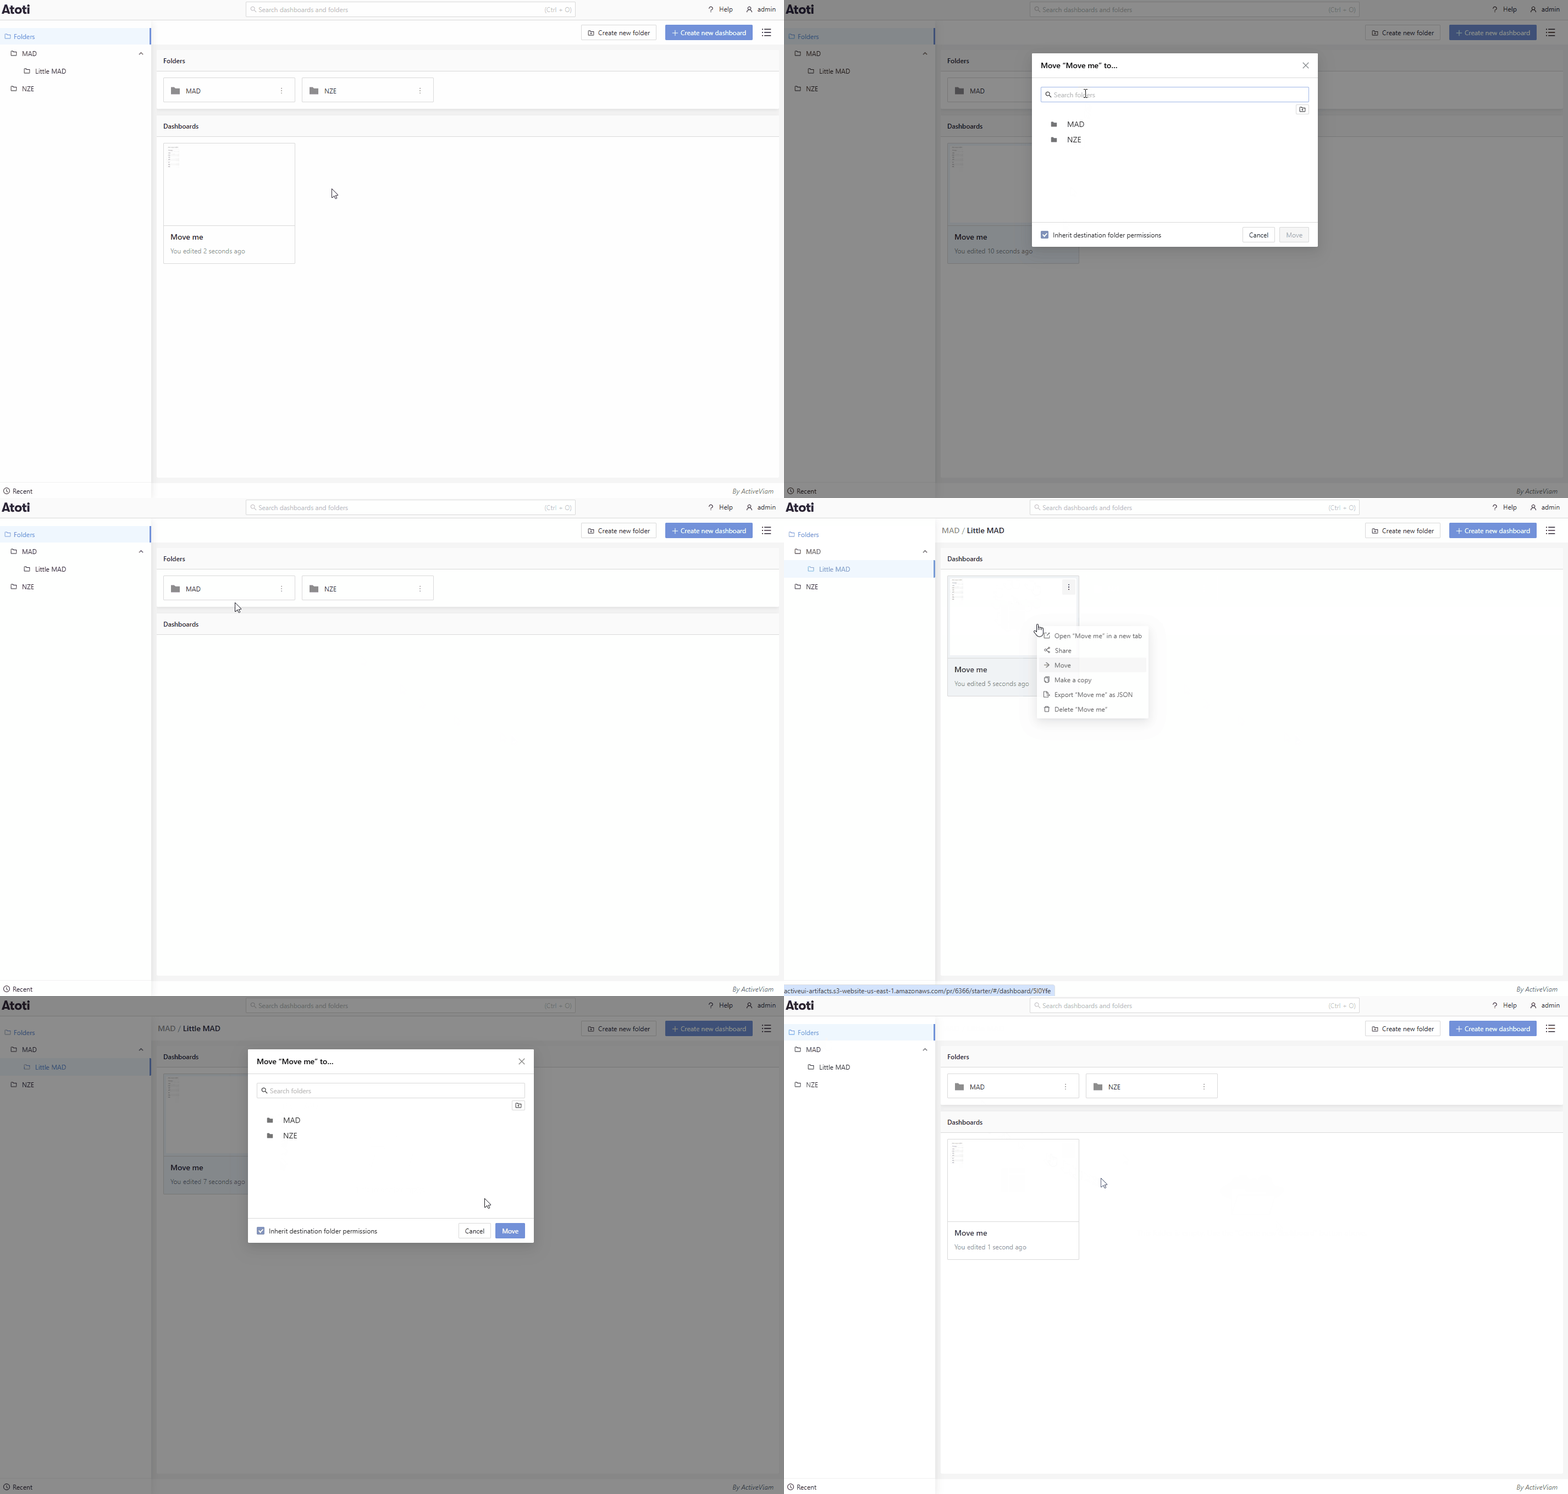
Search in open folder popup
Users can now search for folders in the Move and Save as popups for dashboards.
5.2.17
2025-12-09
Summary
Improvements
Improvements
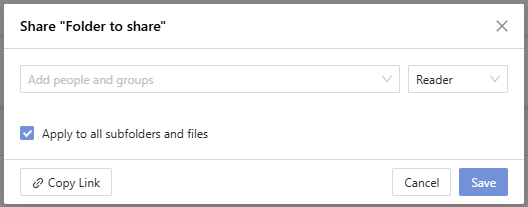
Share contents of folder
Users can decide to share all the folders and dashboards contained within a folder. They can achieve this by checking the checkbox in the Share popup. This feature is only available with Atoti Server 6.1.15 or higher.
5.2.16
2025-12-01
Summary
New features
Improvements
New features
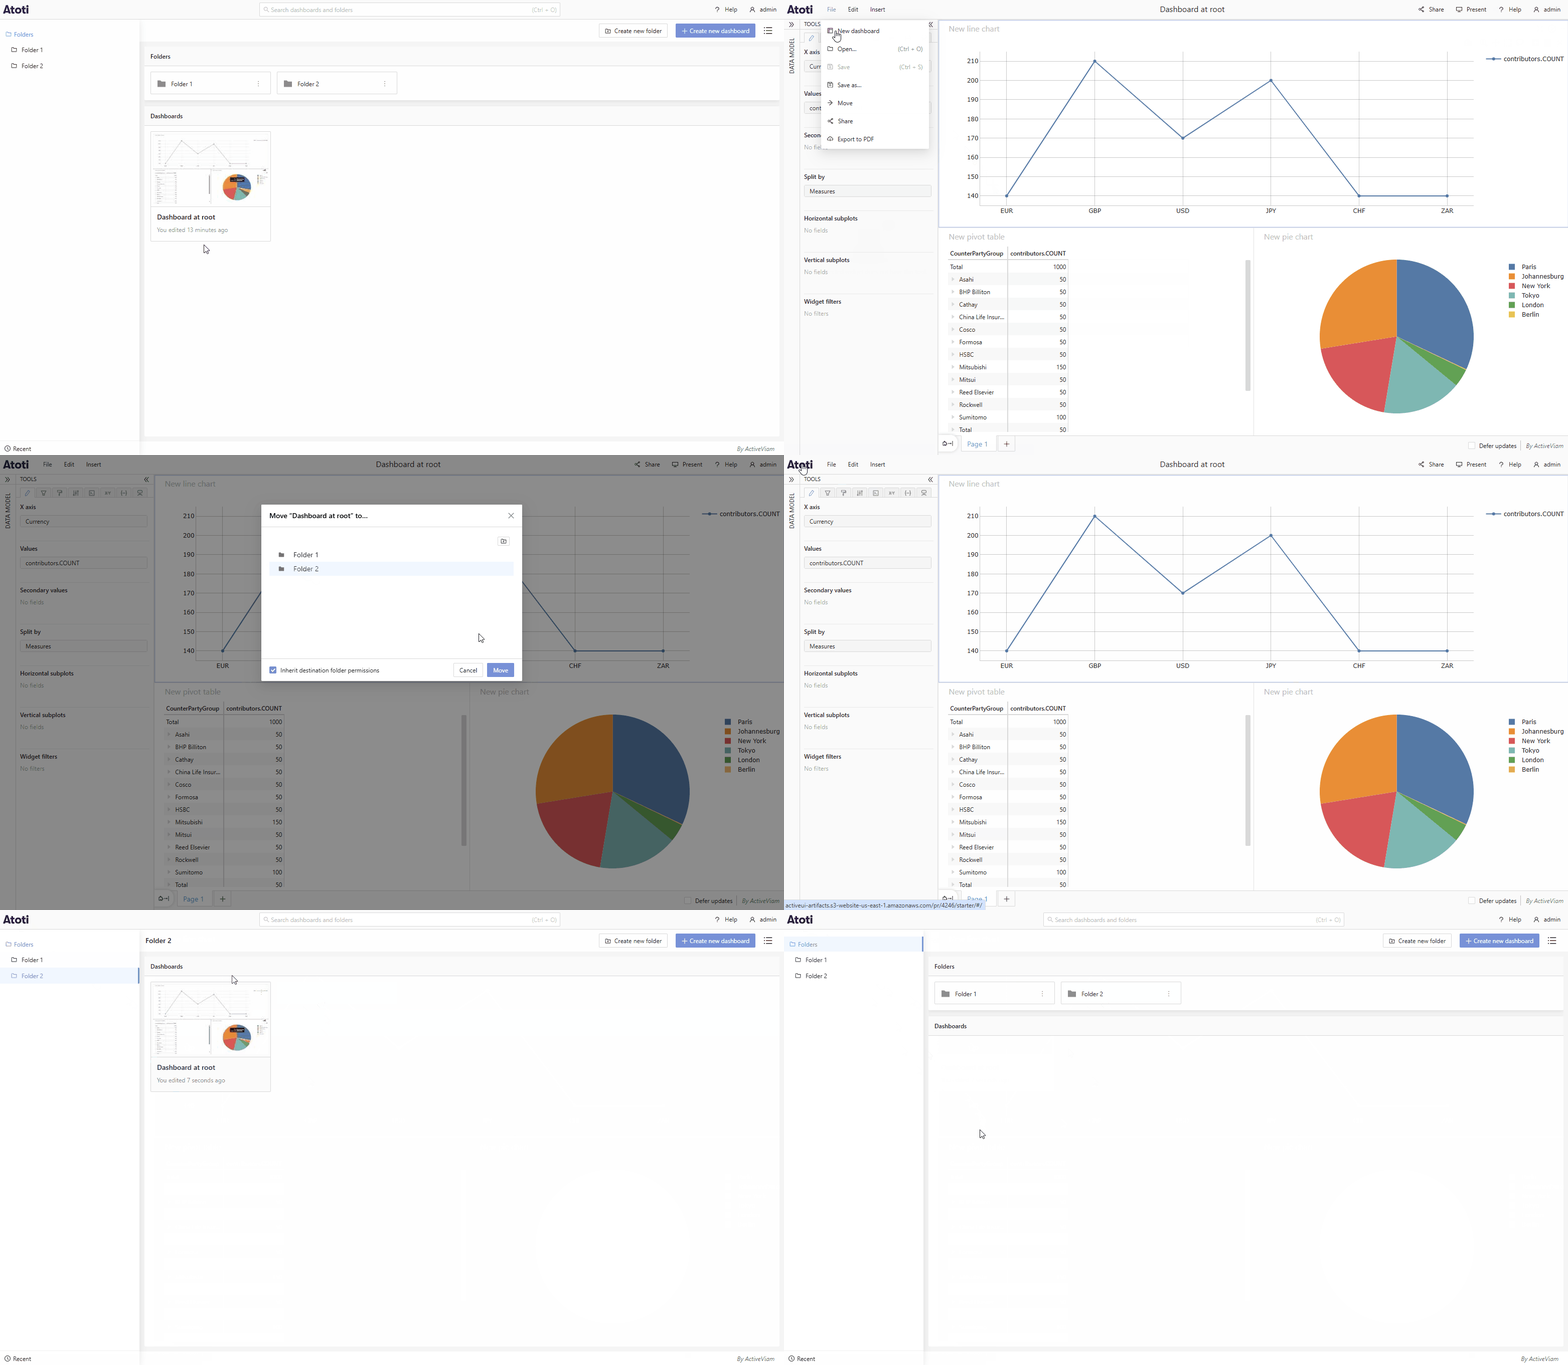
Move dashboard menu item
Users can move dashboards directly from the File menu. This way they do not have to return to the home page to reorganize their folders.
Improvements
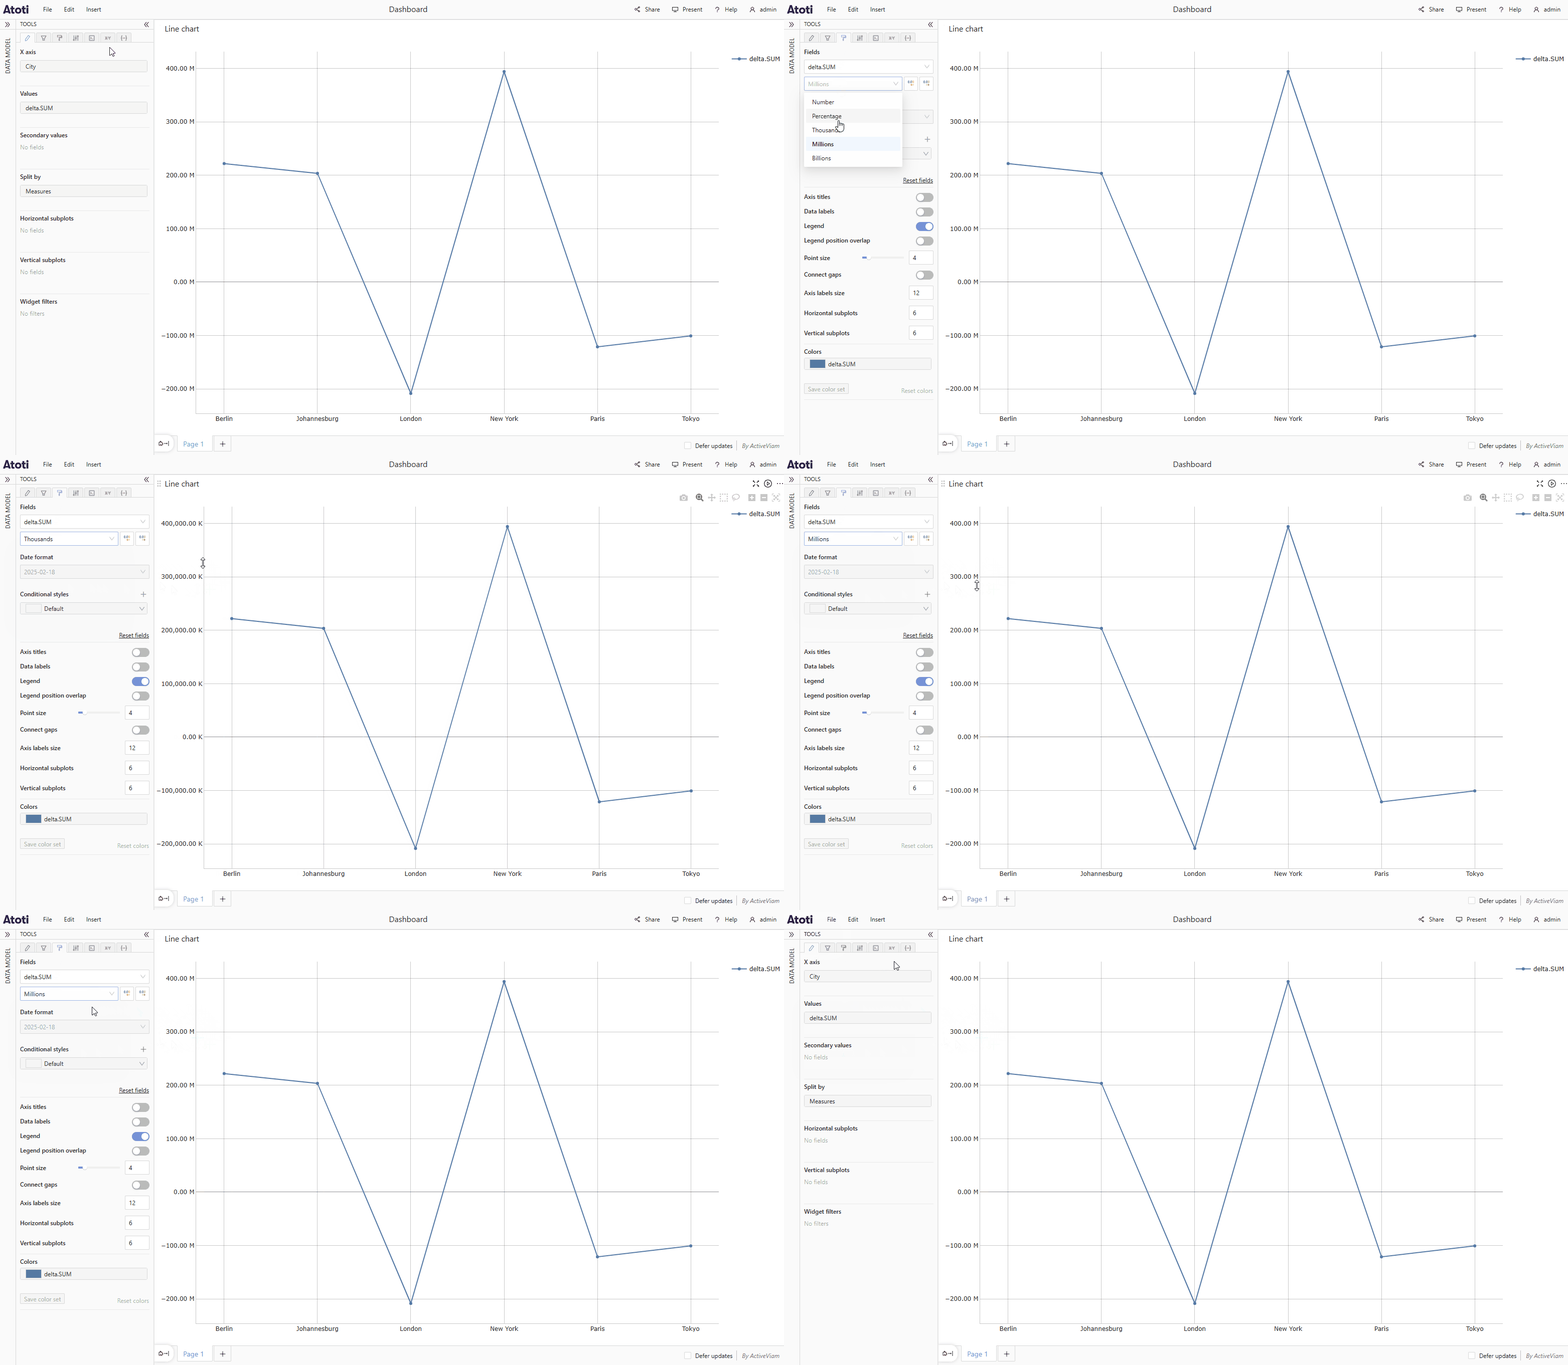
Change axis ticks on charts
Users can format their axis ticks on charts.
5.2.15
2025-10-31
Summary
New features
New features
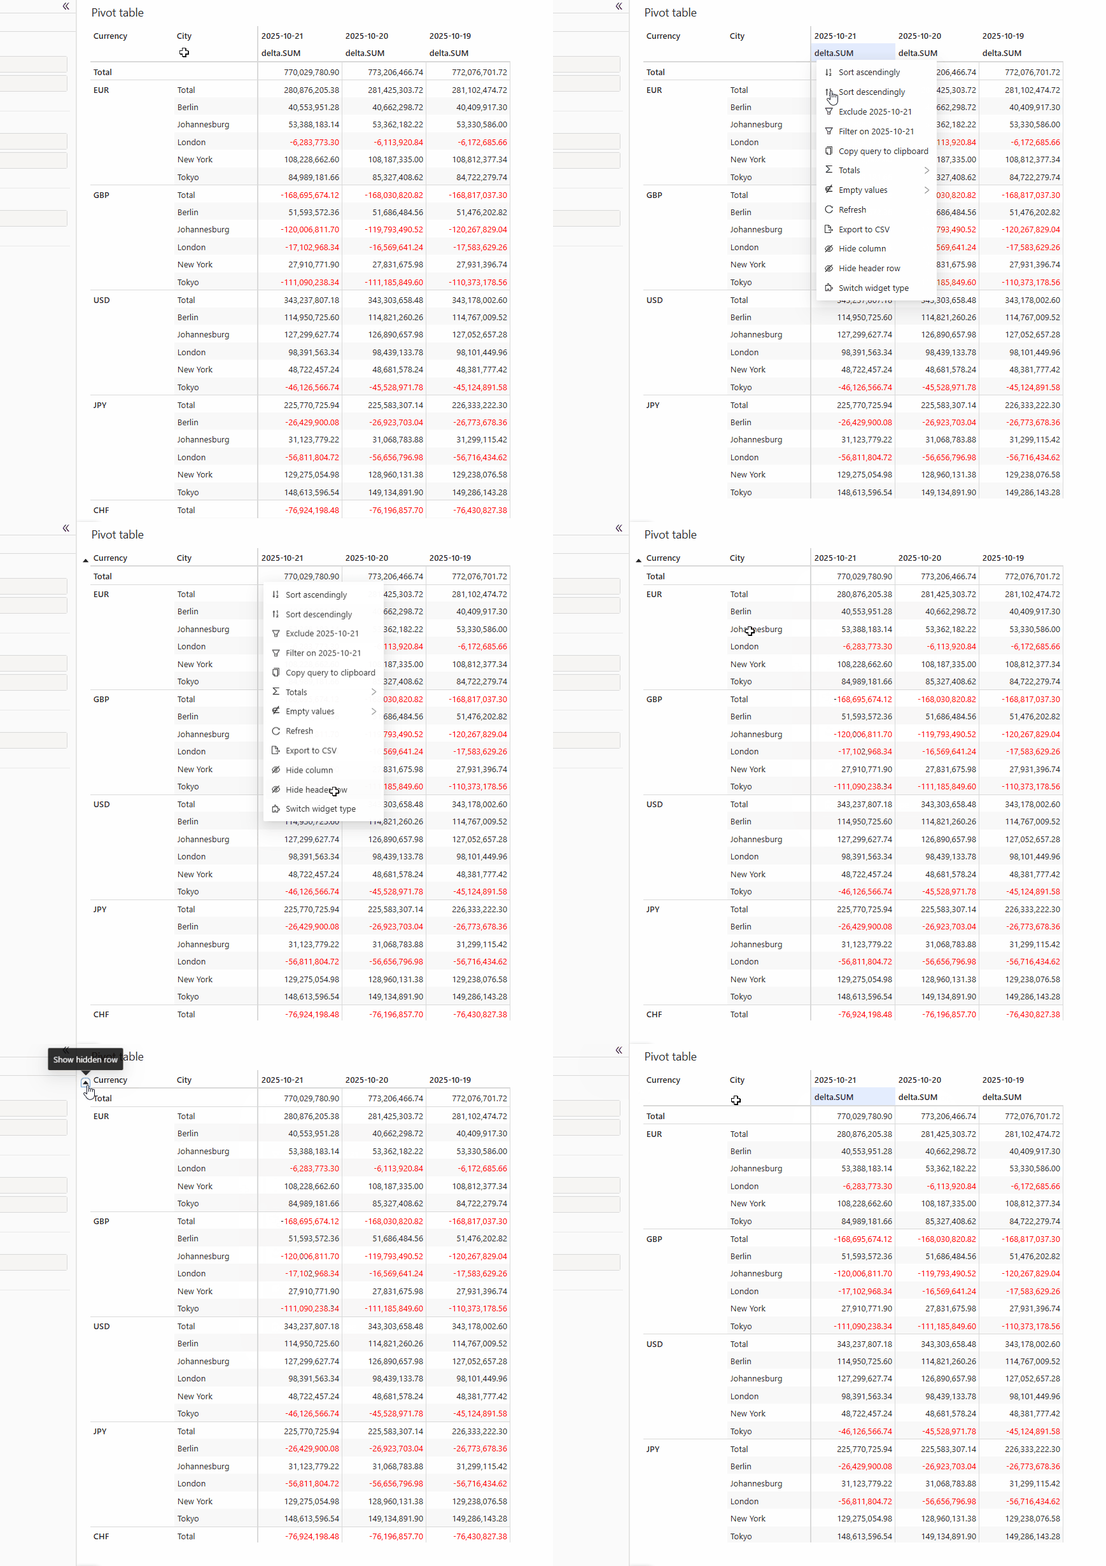
Hide header rows
Users can hide row headers. This can help save space if there is redundant information.
5.2.14
2025-09-30
Summary
New features
Improvements
New features
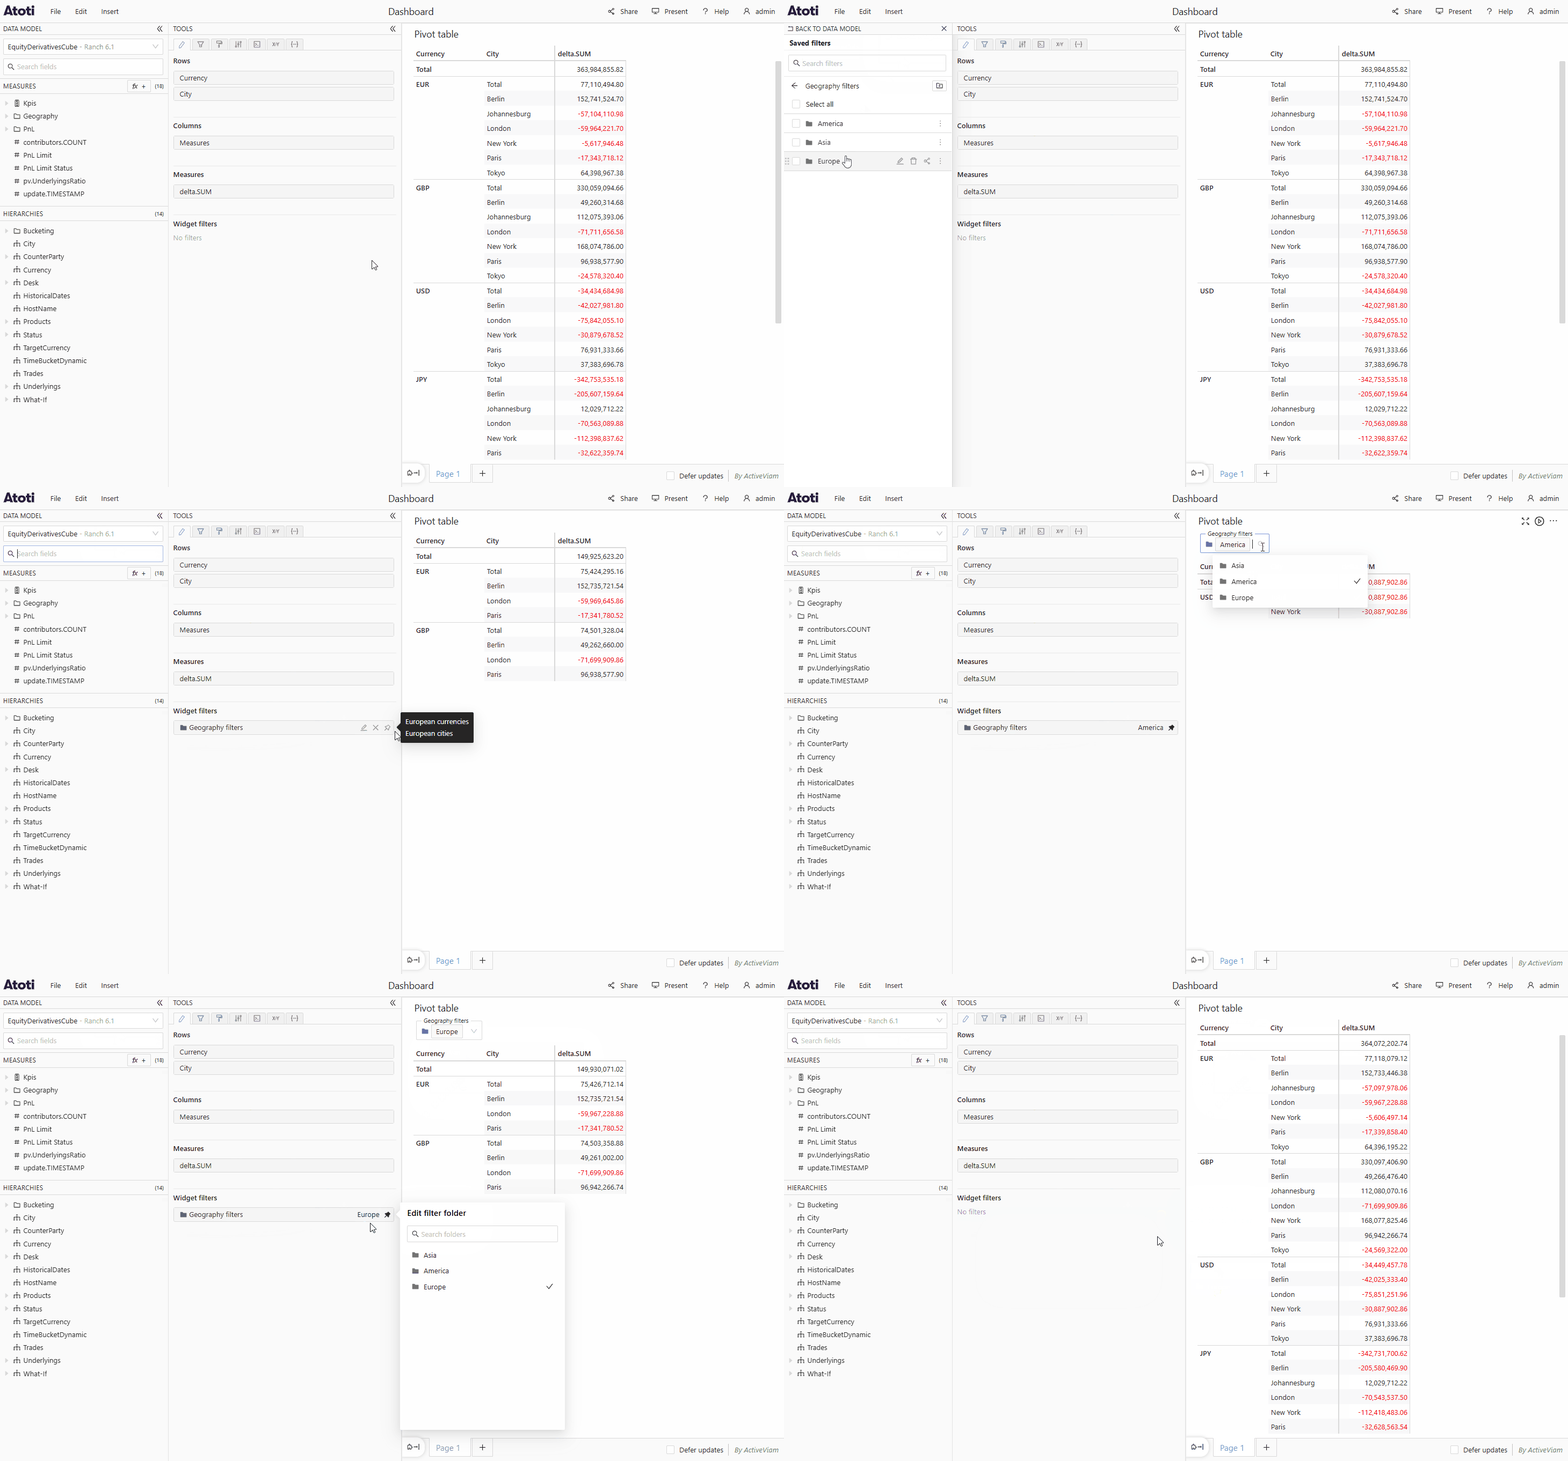
Add filter folders
Users can group relevant filters in folders and then quickly switch from one group to another using folders in Saved filters.
Improvements
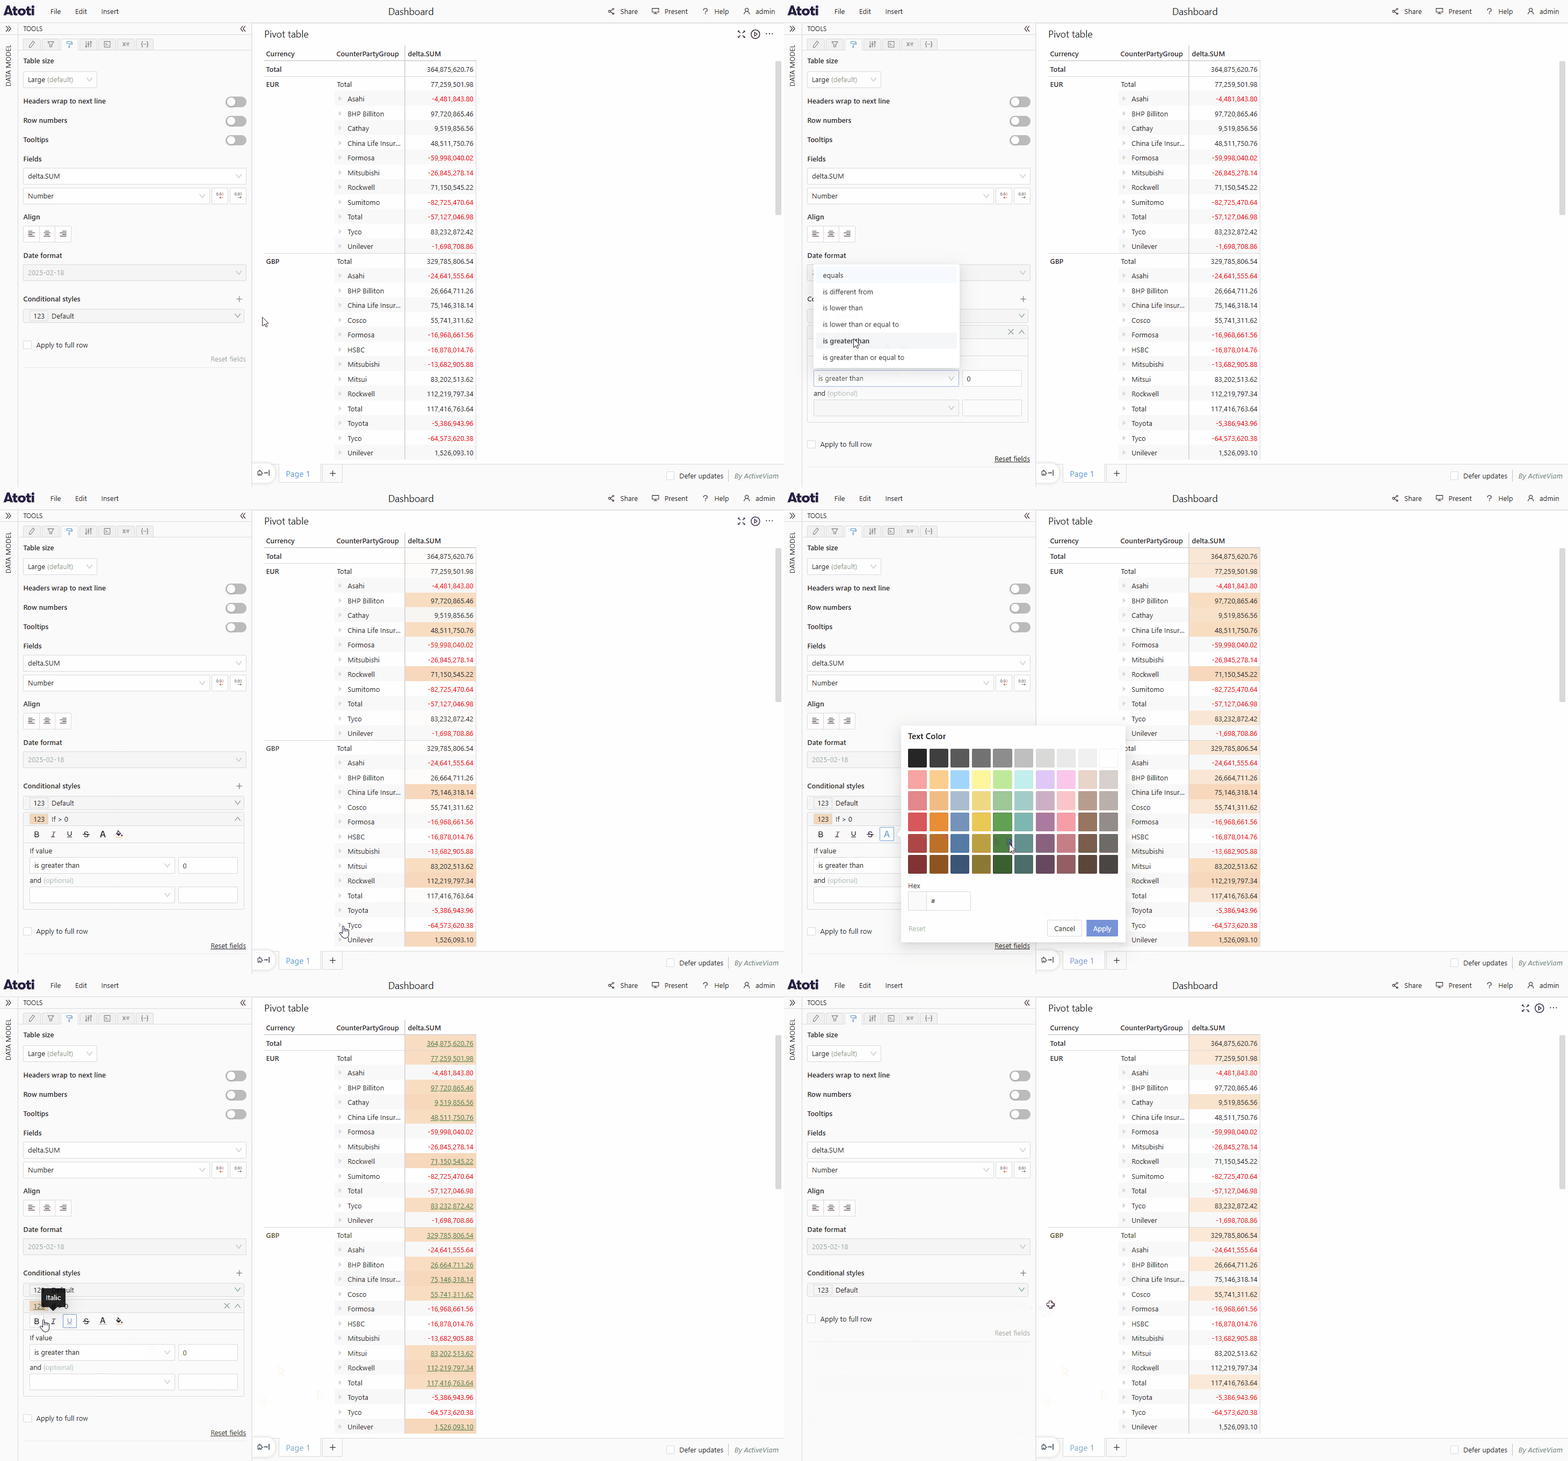
Improved conditional styles for tables
Users have more comprehensive options for styling tables. They can now change the text and background color, and bold, italic, underline, and strikethrough the text.
5.2.13
2025-08-30
Summary
New features
New features
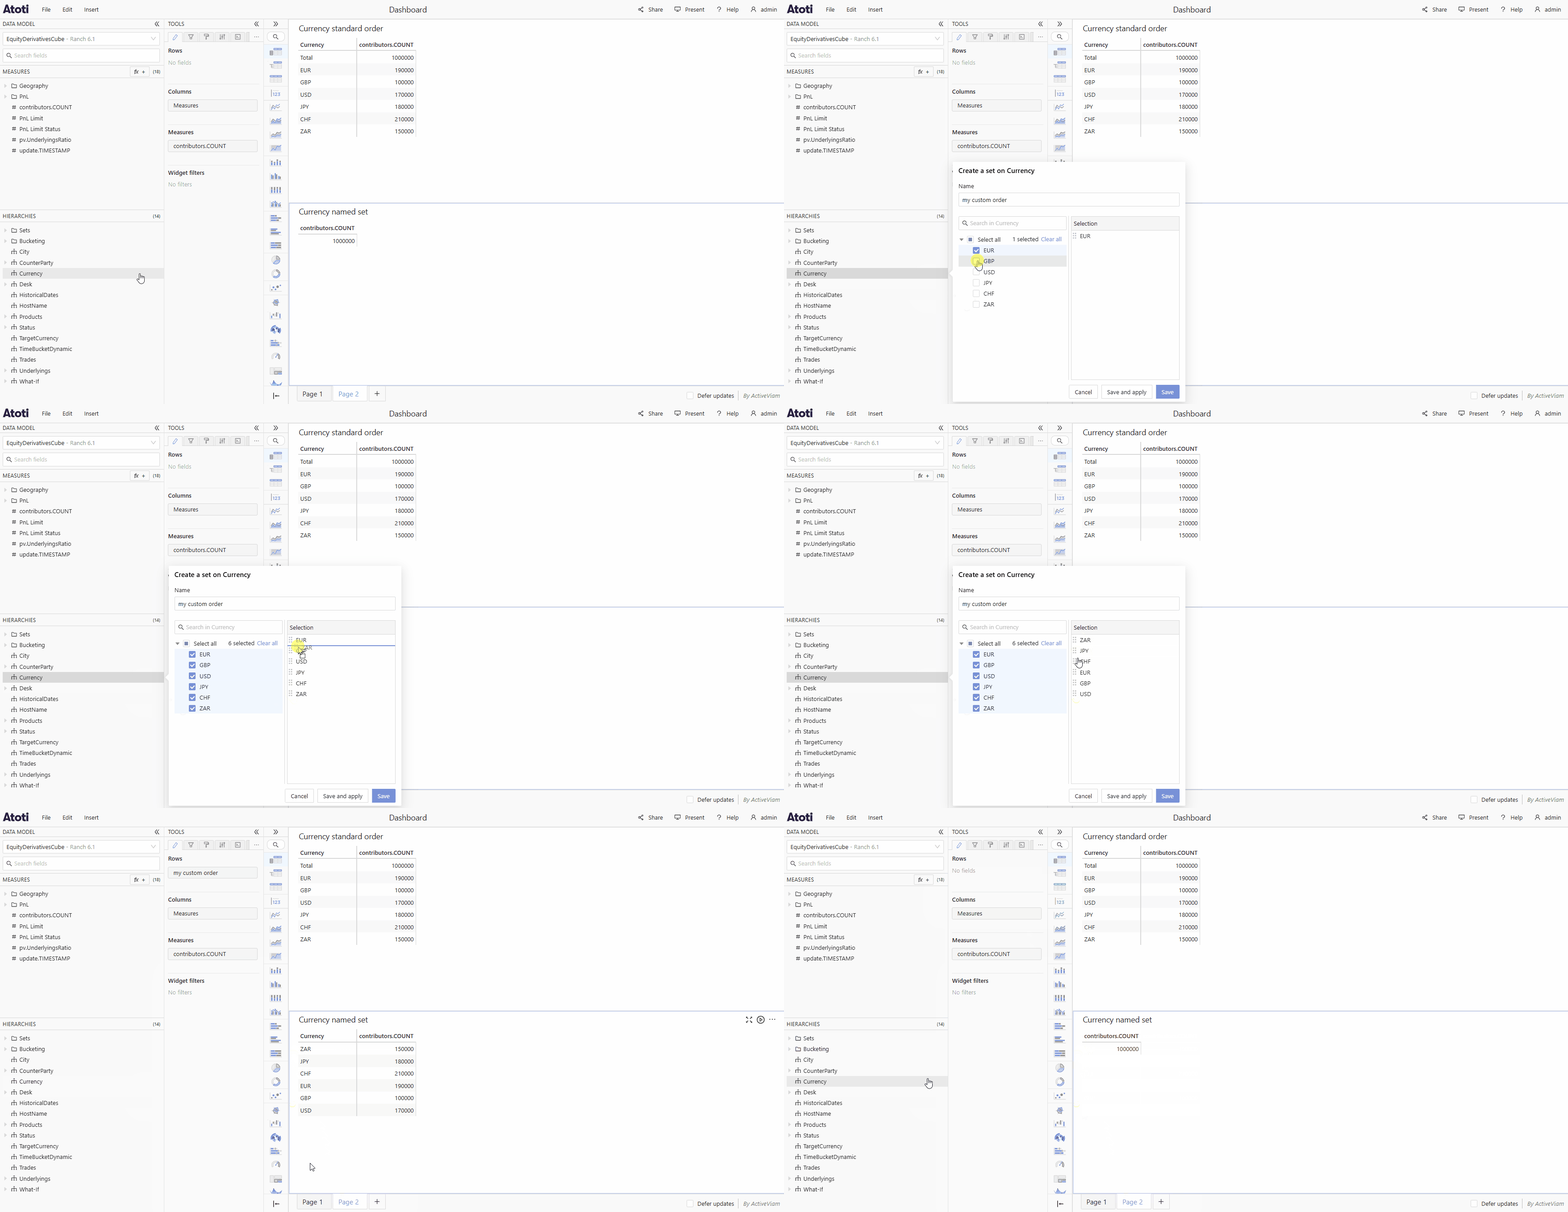
Create named sets
It is now possible to create named sets which include members from several levels within a dimension. These can be reordered to have custom orders when adding them to tables or other widgets.
5.2.12
2025-07-31
Summary
New features
Improvements
New features
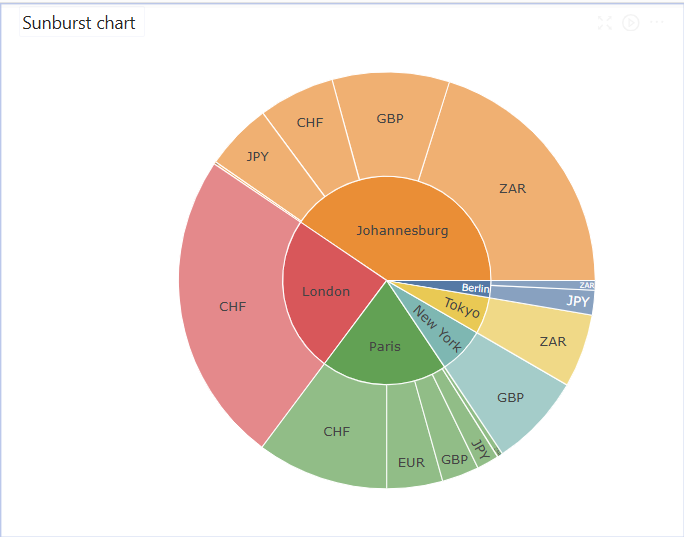
Sunburst chart
The sunburst chart was added as a new widget. This widget will be especially useful for visualizing hierarchical data.
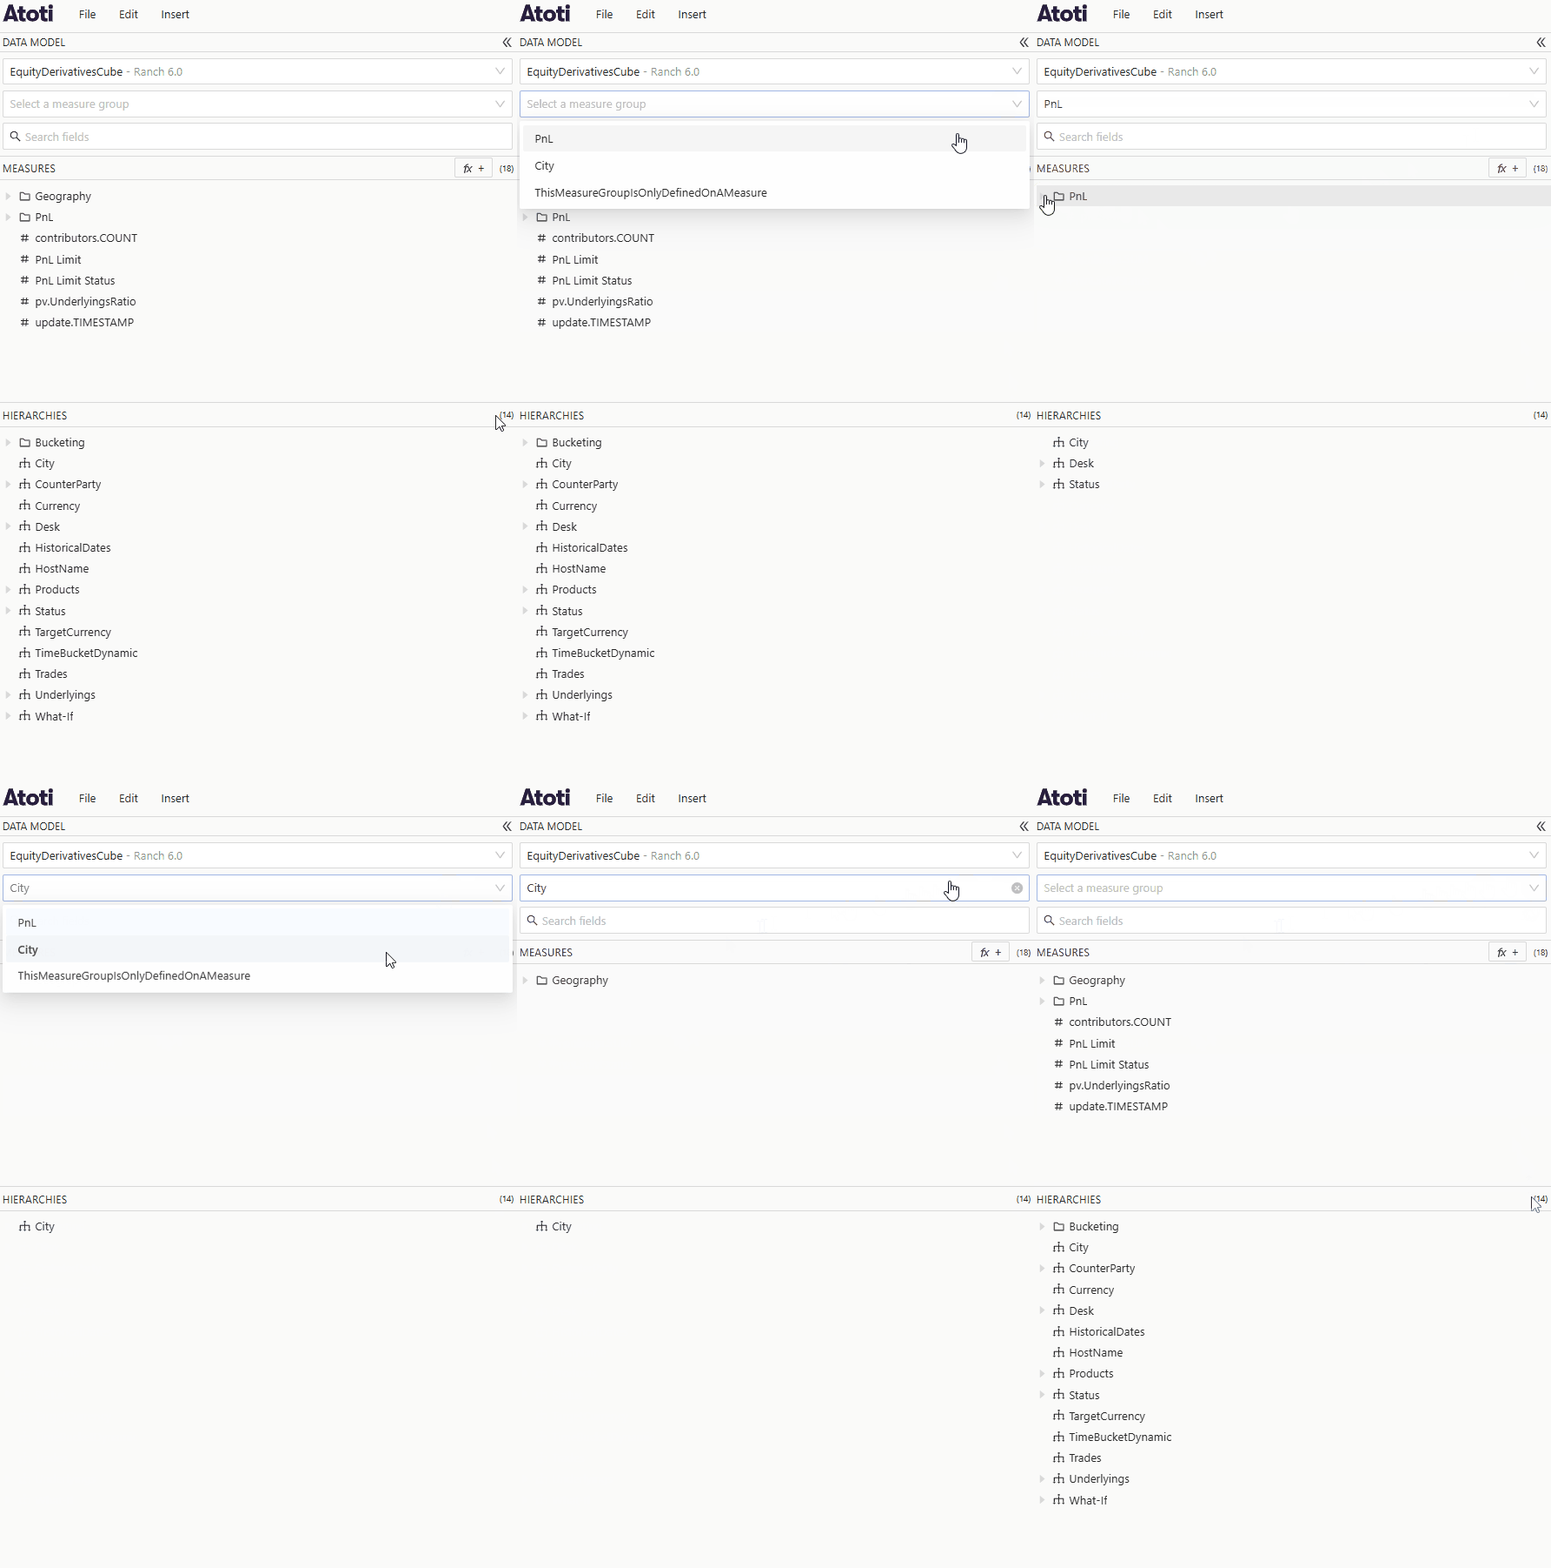
Measure groups
Users can now display measure groups in the UI. This allows you to group measures and hierarchies together, to make sure that all the relevant data is easily found.
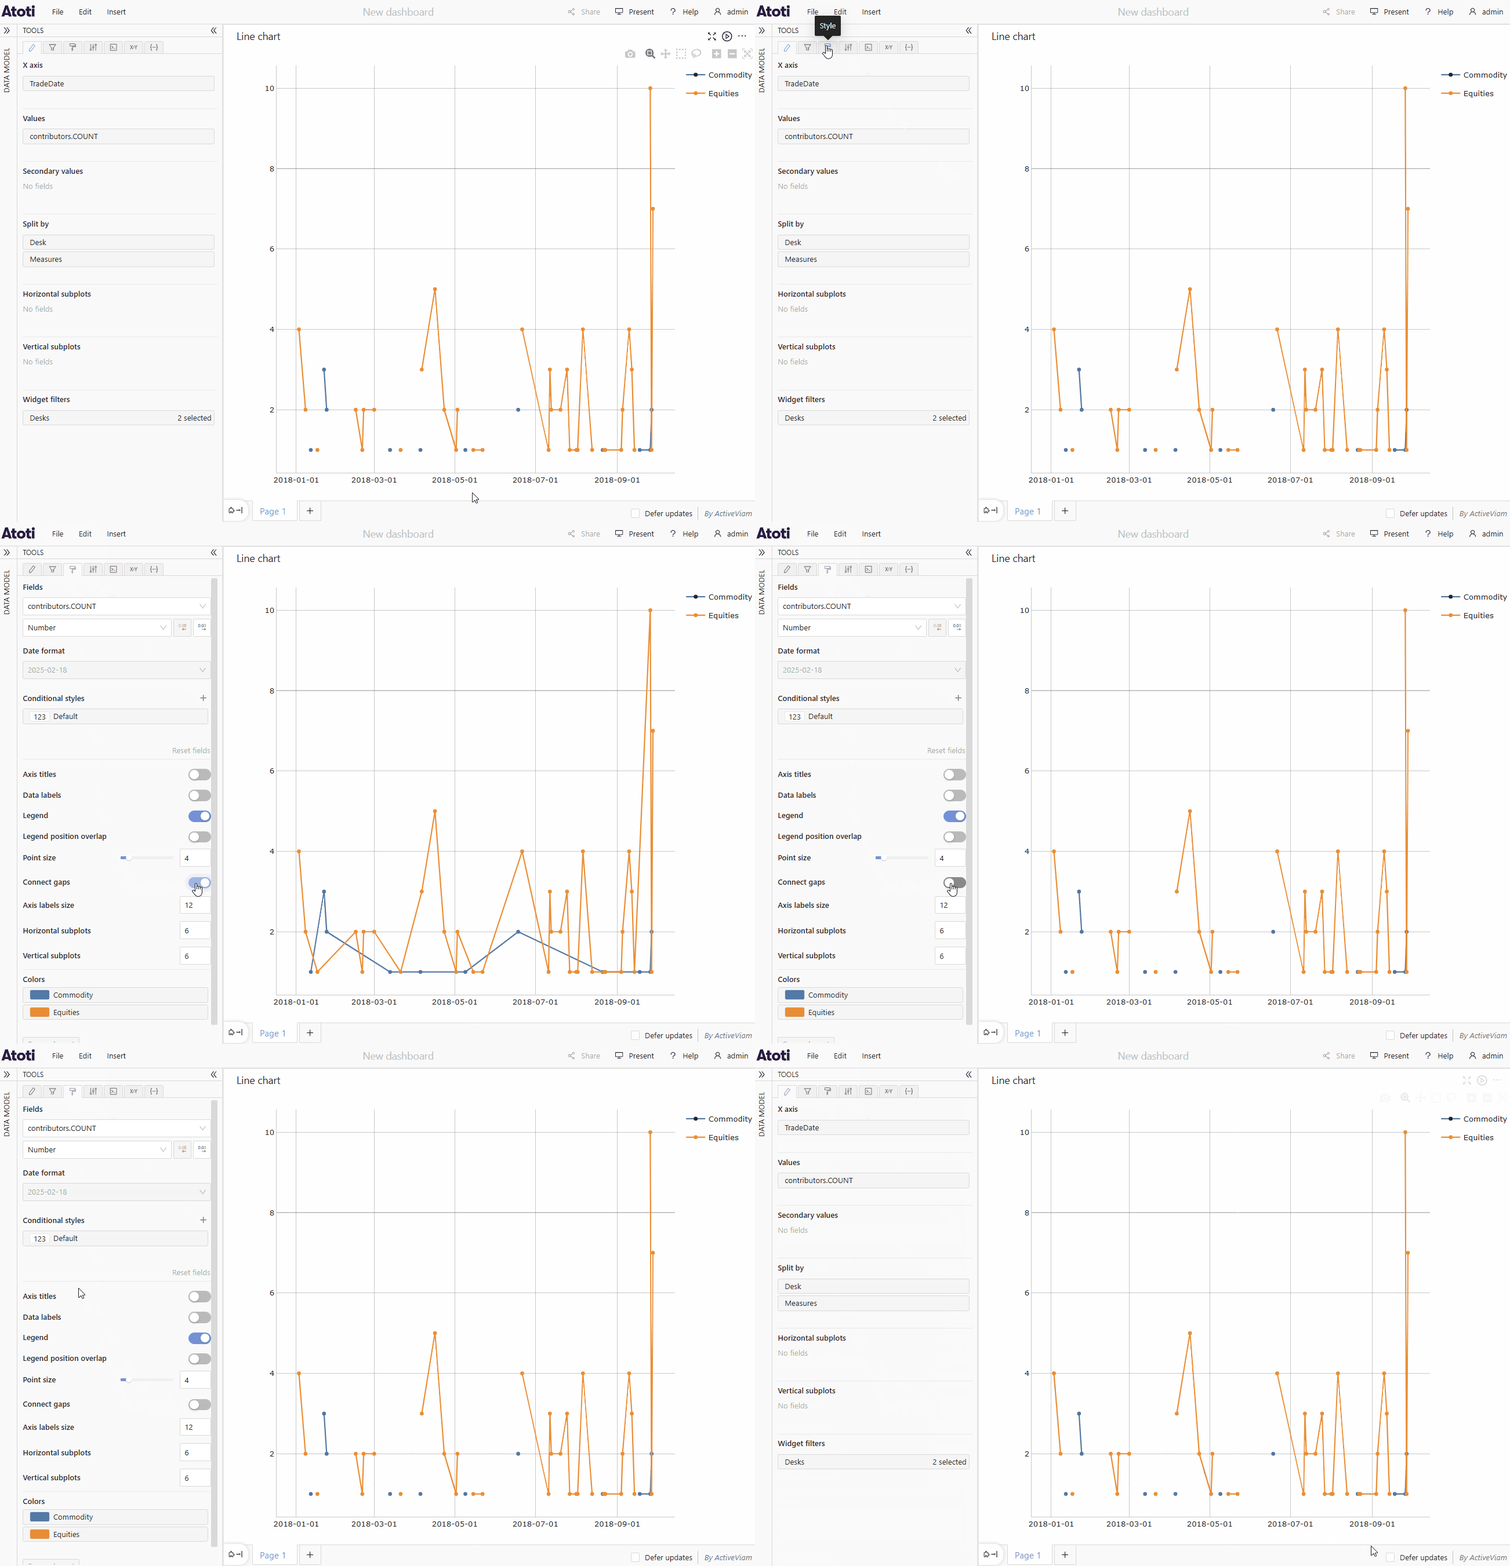
Connect gaps in line charts
Line charts with gaps in the data can be connected in the Style tab.
Improvements
Shortcut to toggle Present mode
Alt + p toggles Present mode.
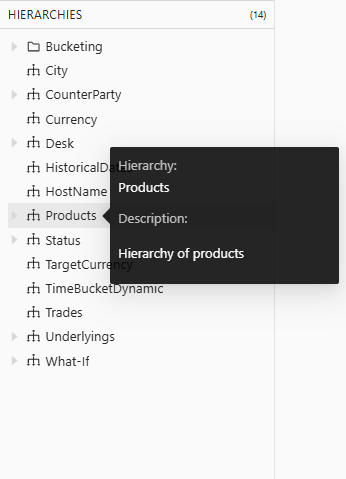
Description tooltips for dimensions
One can now show the description of a dimension, hierarchy or level by hovering over it. It is displayed in a tooltip.
5.2.10
Summary
2025-06-30
Improvements
Improvements
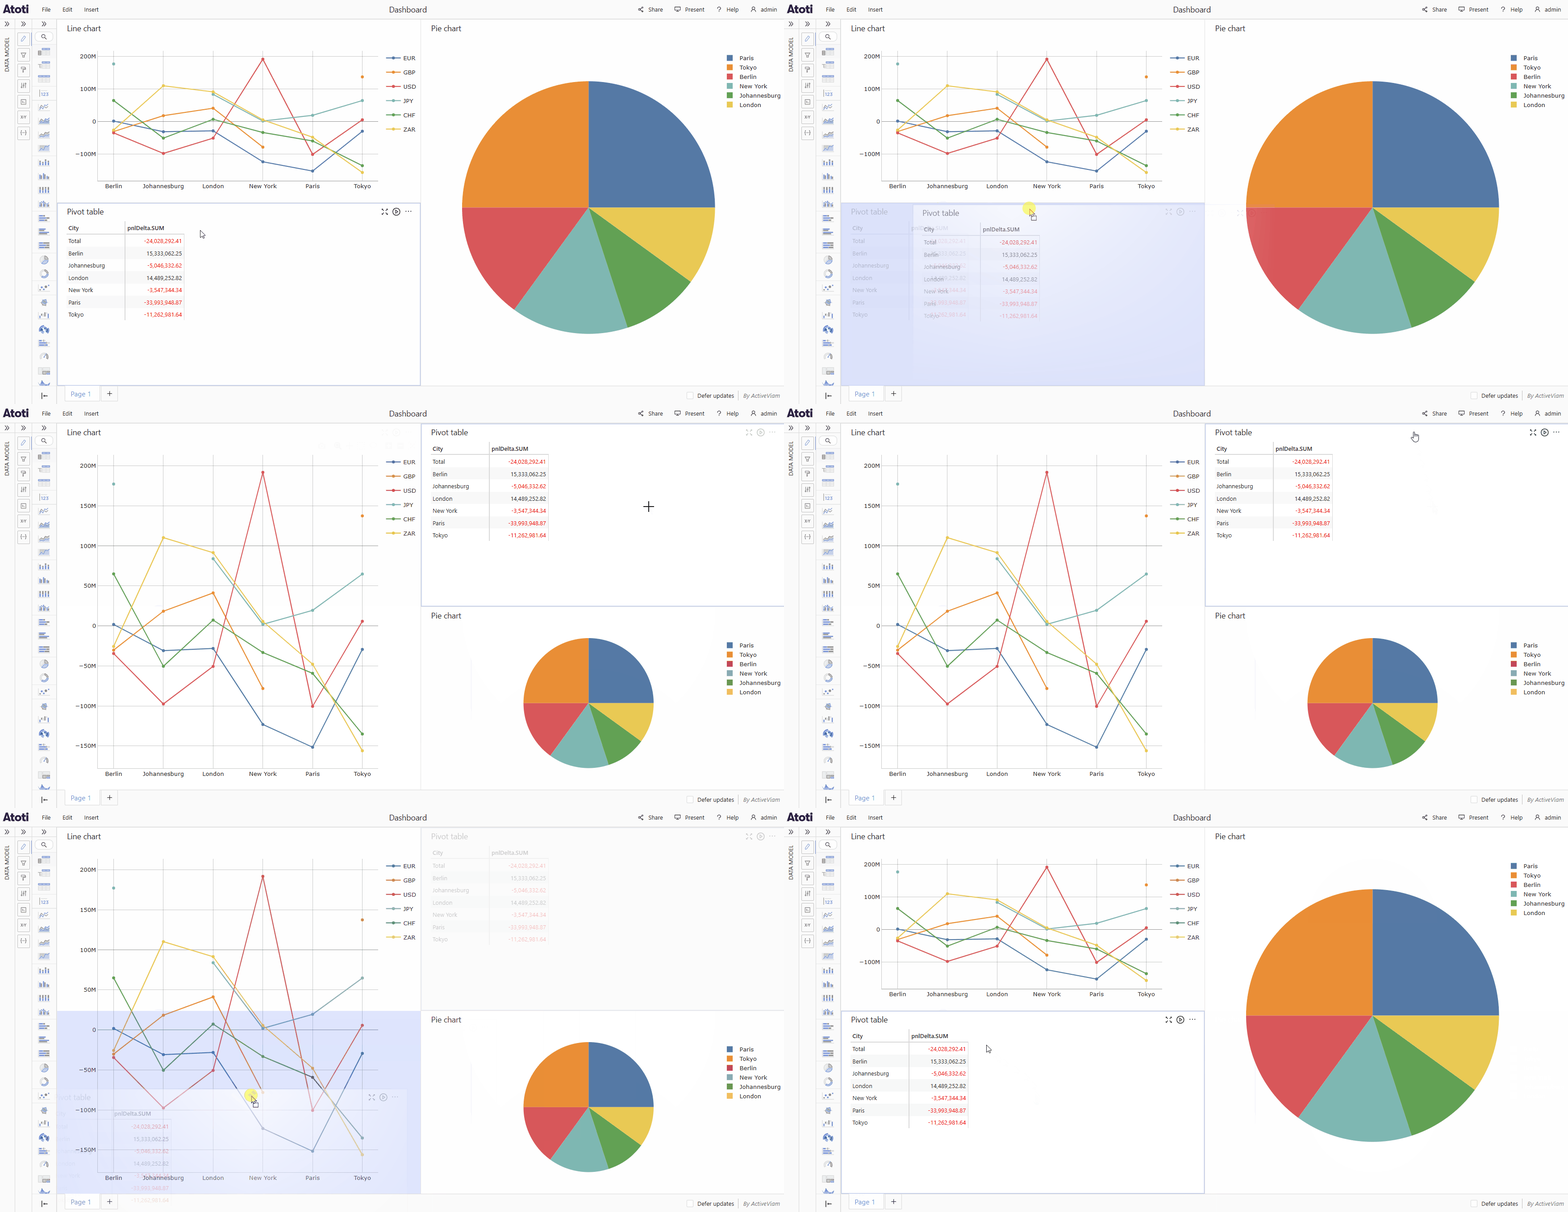
Dashboard layout when dropping widgets
When moving a widget, the dashboard layout does not change until the widget is dropped. You can cancel the move by dragging the widget back to its original place or off screen.
5.2.9
Summary
2025-05-28
Improvements
Improvements
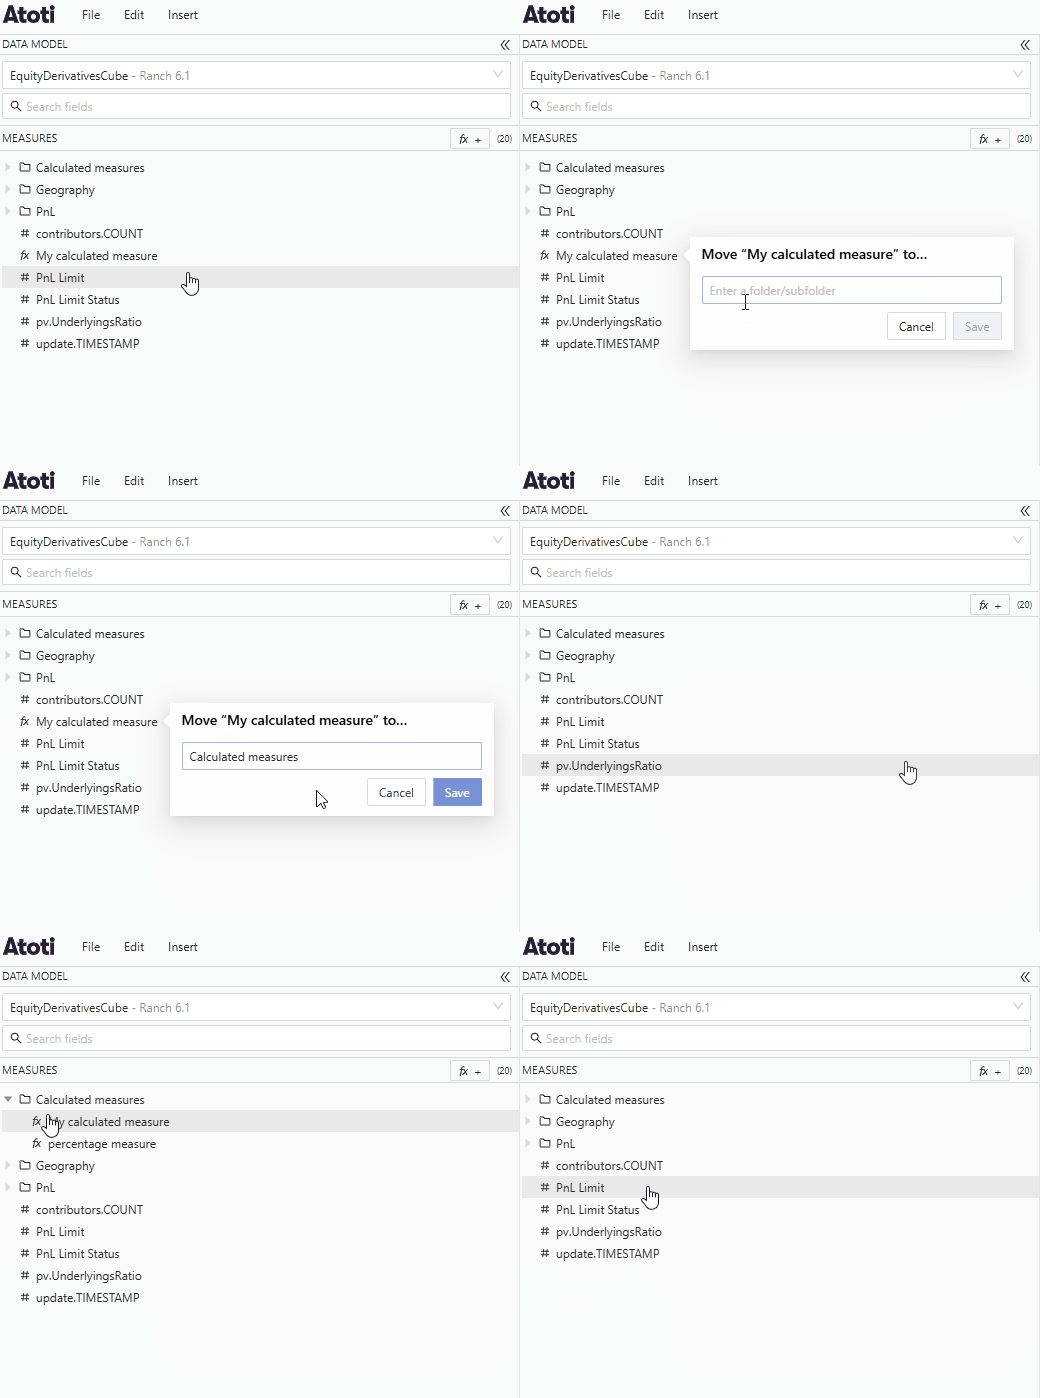
Move calculated measures
You can now quickly move calculated measures into folders by using their context menu and choosing the Move option.
5.2.8
2025-05-01
Summary
New features
Improvements
New features
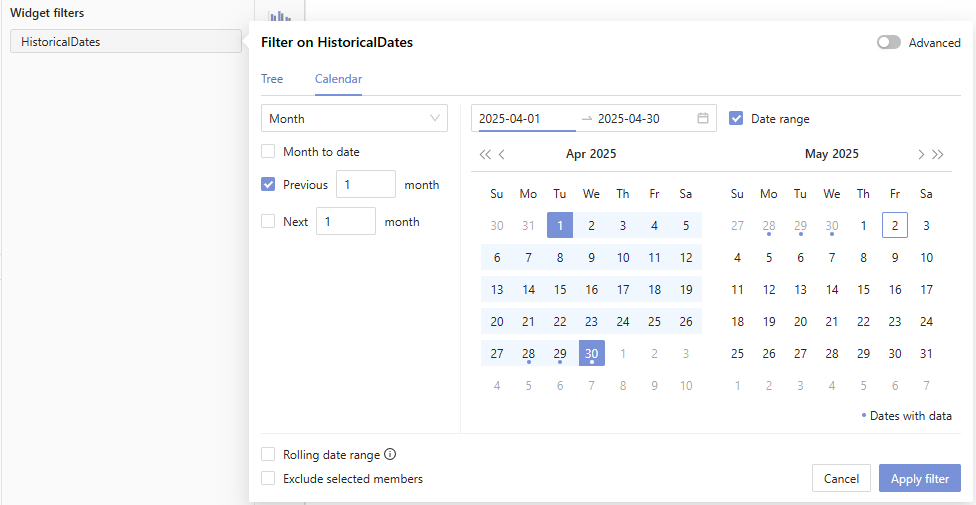
Previous date filters
You can now add filters on the next or previous day, week, month, quarter or year. This is accessible in the calendar view on the filter popover for date hierarchies.
Improvements
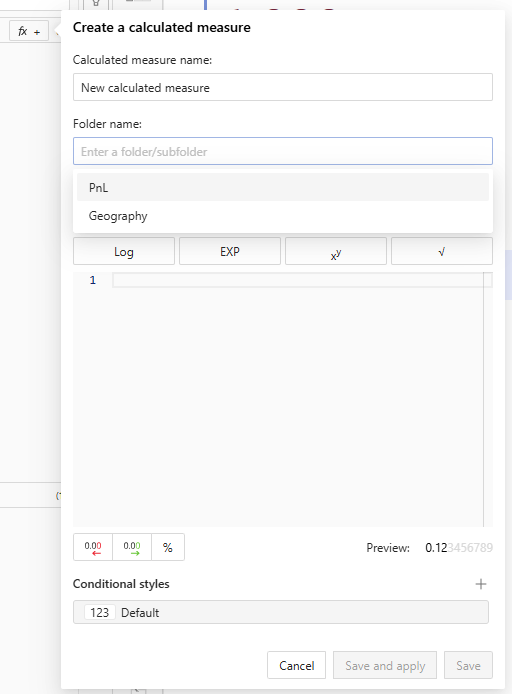
Save calculated measures in folders
Calculated measures can now be saved in folders as you create them. You can also move a measure after creation by right-clicking to edit it, then specifying the folder.
Context menus for tree maps
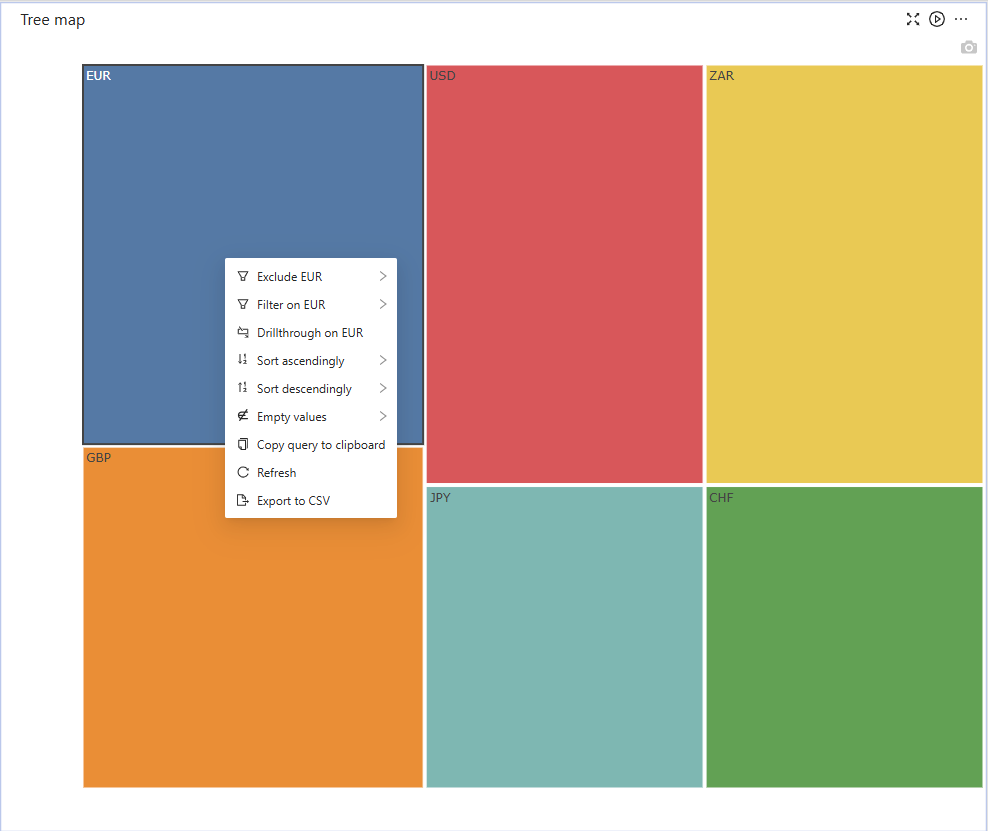
Improved support for tree maps by adding a context menu. Now you can right-click a section of a tree map and create a drillthrough table, or filter on it or other widgets.
Style KPI widgets with MDX
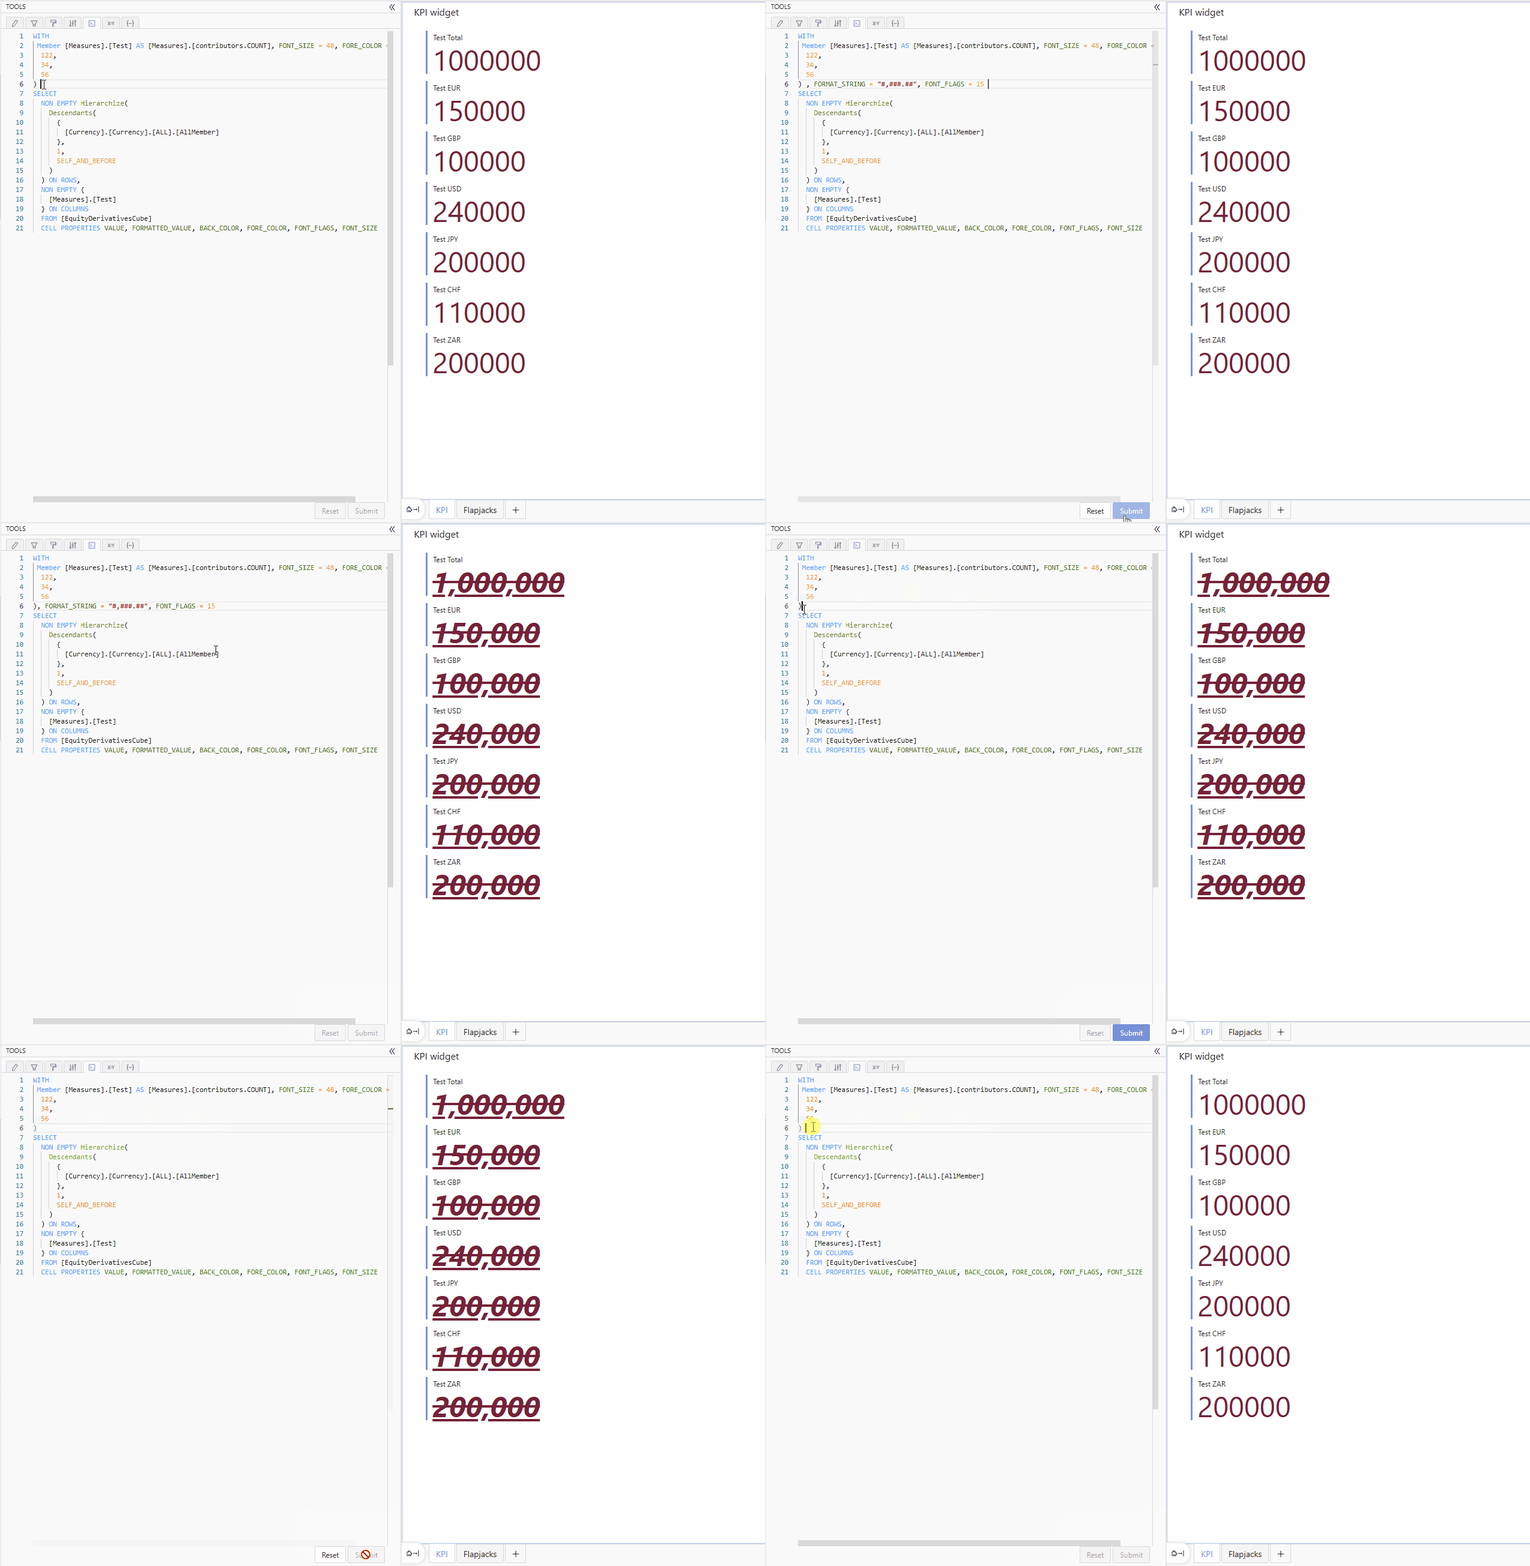
KPI widgets respect font flags that you create in MDX by using the Query tab. With these font flags, you can format the text in the KPI, e.g. making it bold or underlining it.
5.2.7
2025-04-01
Summary
New features
- Apply filters to other widgets on double click
- Tree table level names
- Open dashboards in a separate tab
Improvements
New features
Apply filters to other widgets on double click
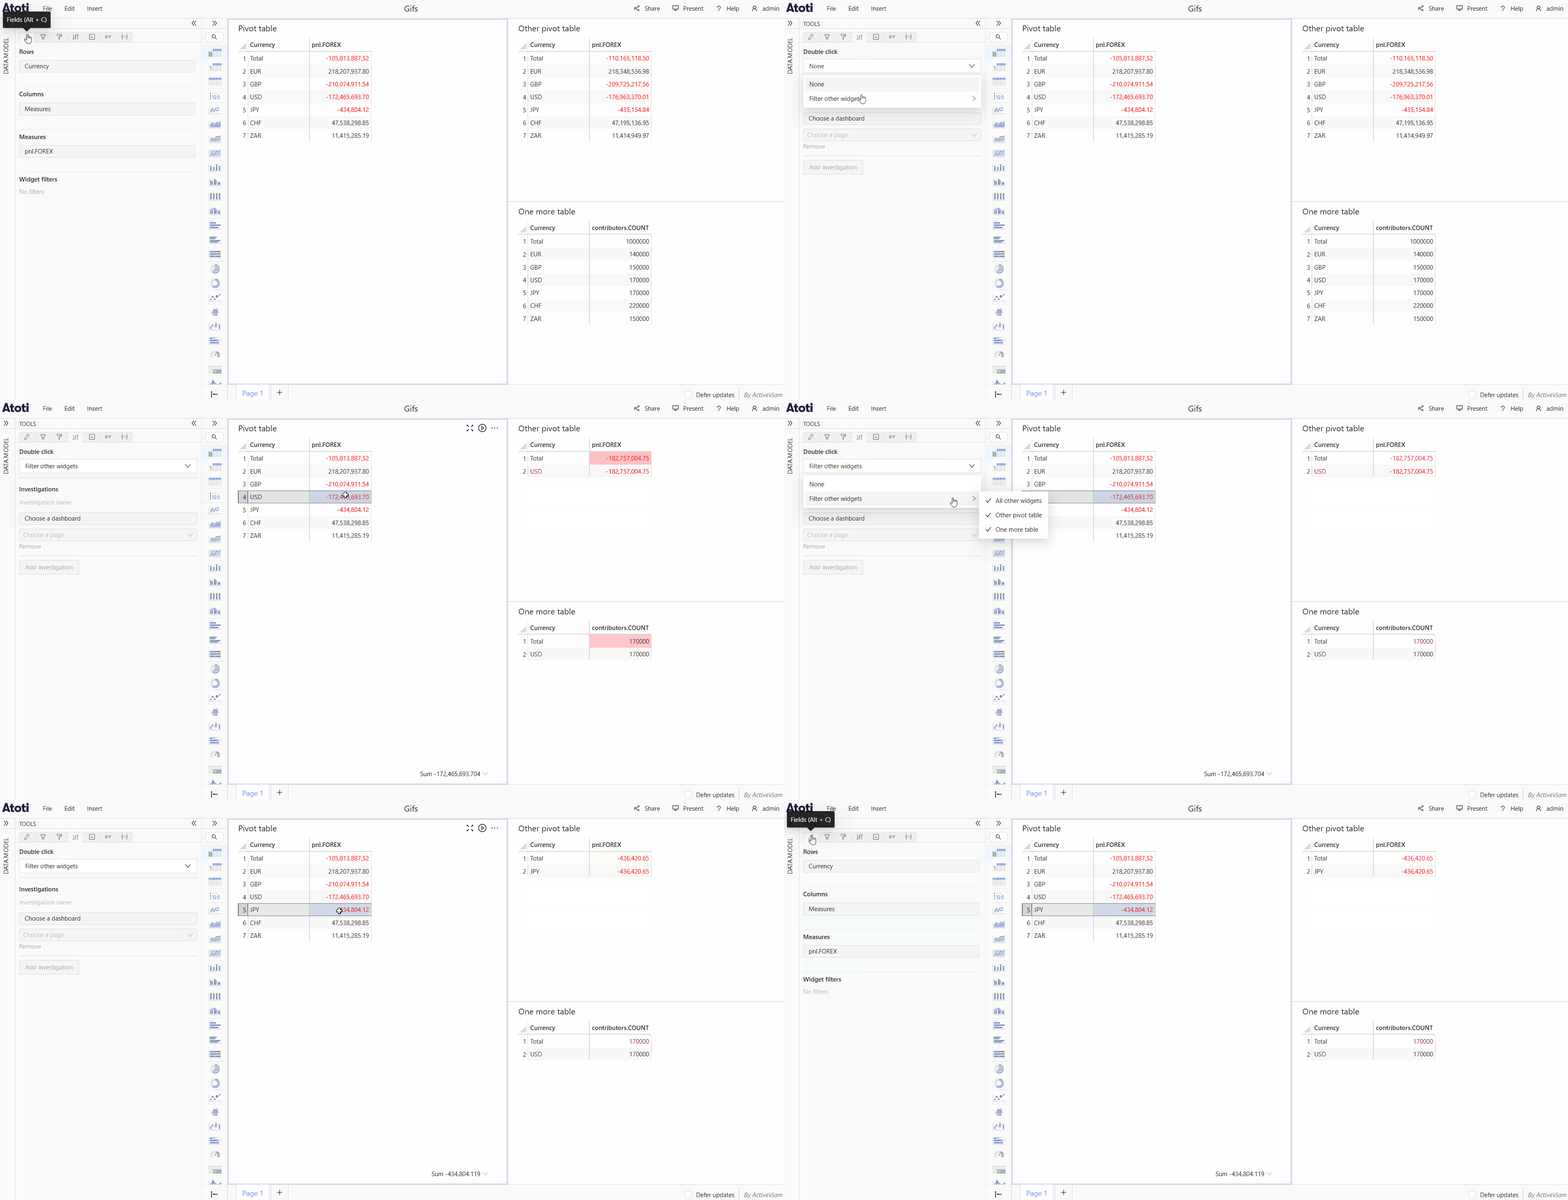
You can set up a double click action on a table widget in the Behavior tab, which can then be used to apply any filters from the widget to one or more other widgets on the same page by double clicking on a row.
Tree table level names
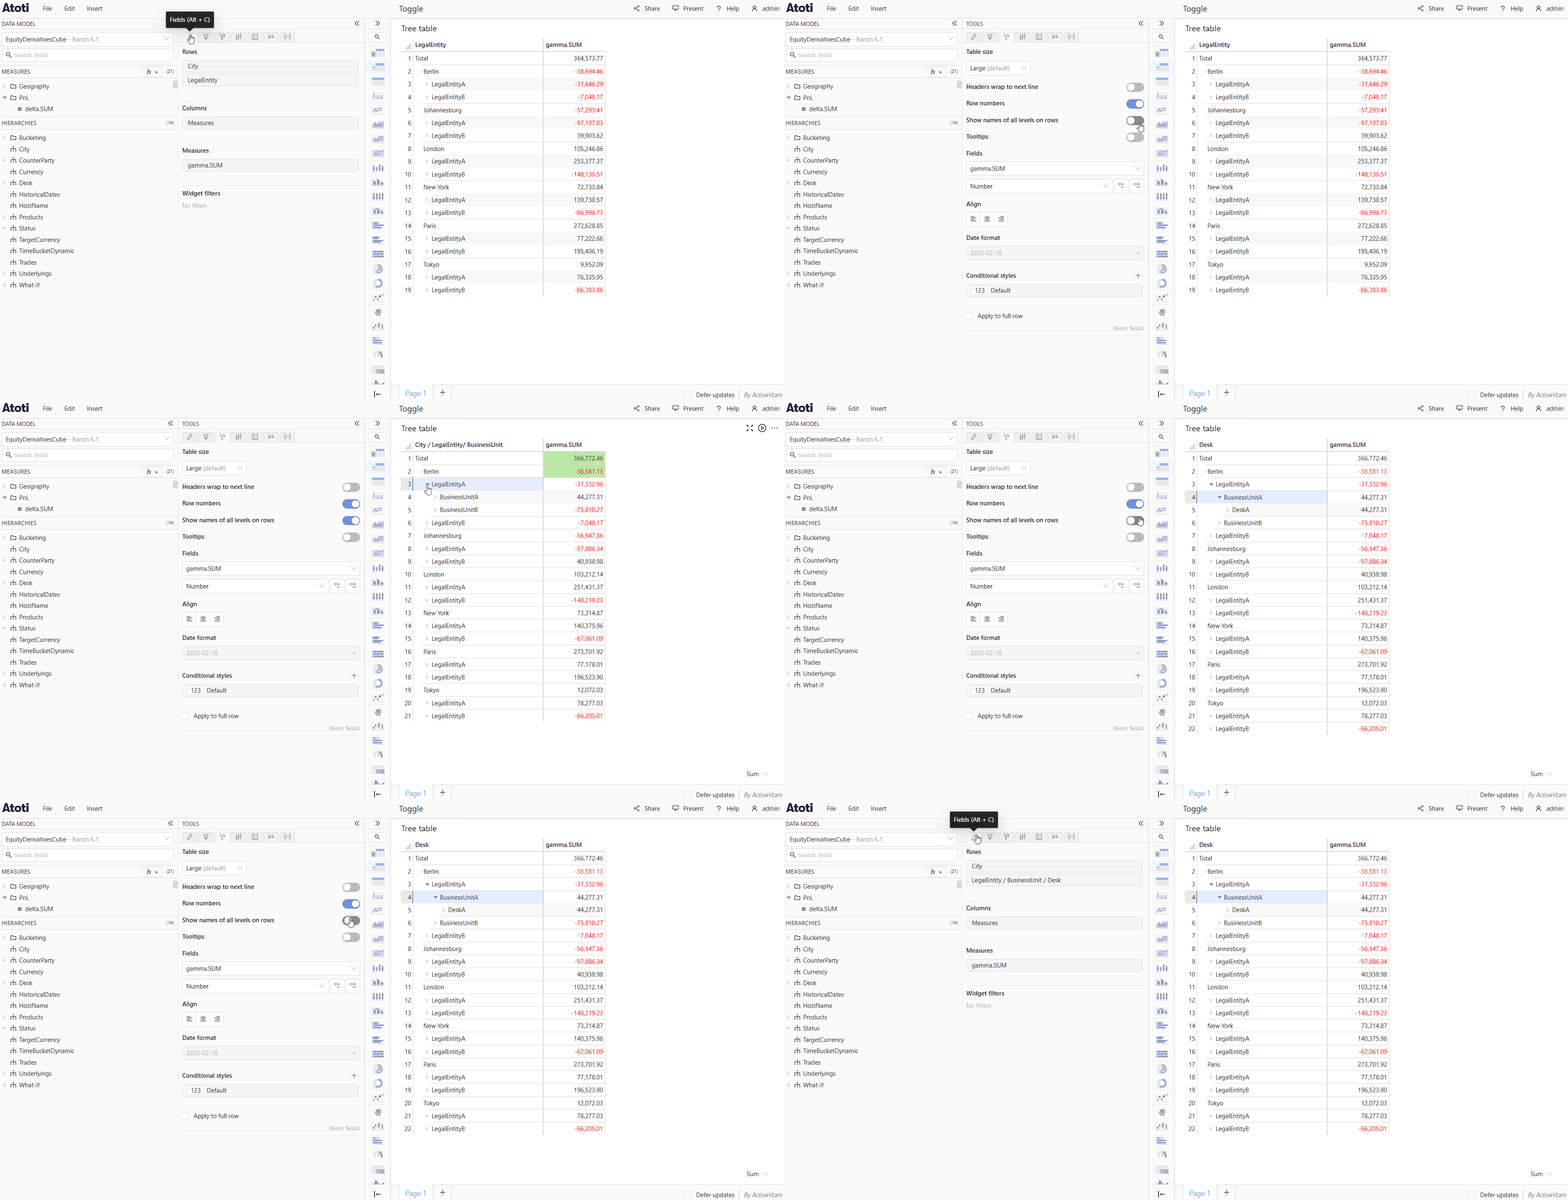
You can display all level names or just the deepest level name in the header of tree tables via the Show names of all levels on rows toggle in the Style editor of the Tree table.
Open dashboards in new tab
Dashboards can now be opened in new tabs. You can either open a dashboard by mouse-wheel-clicking on it, or by right-clicking and selecting the Open "dashboard name" in a new tab context menu item.
Improvements
More visible measure descriptions
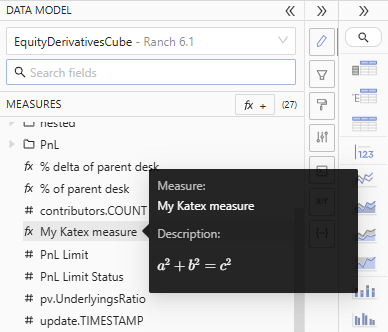
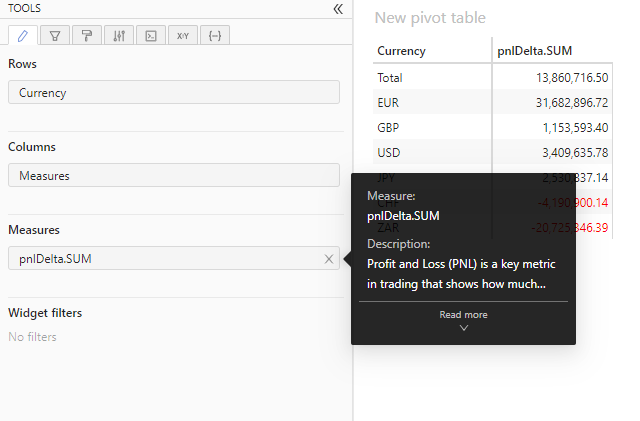
Measures descriptions written by the development team in Katex are displayed on the measure's tooltip when you hover on the list of measures.
5.2.6
2025-02-28
Summary
New features
Improvements
New features
3D surface chart
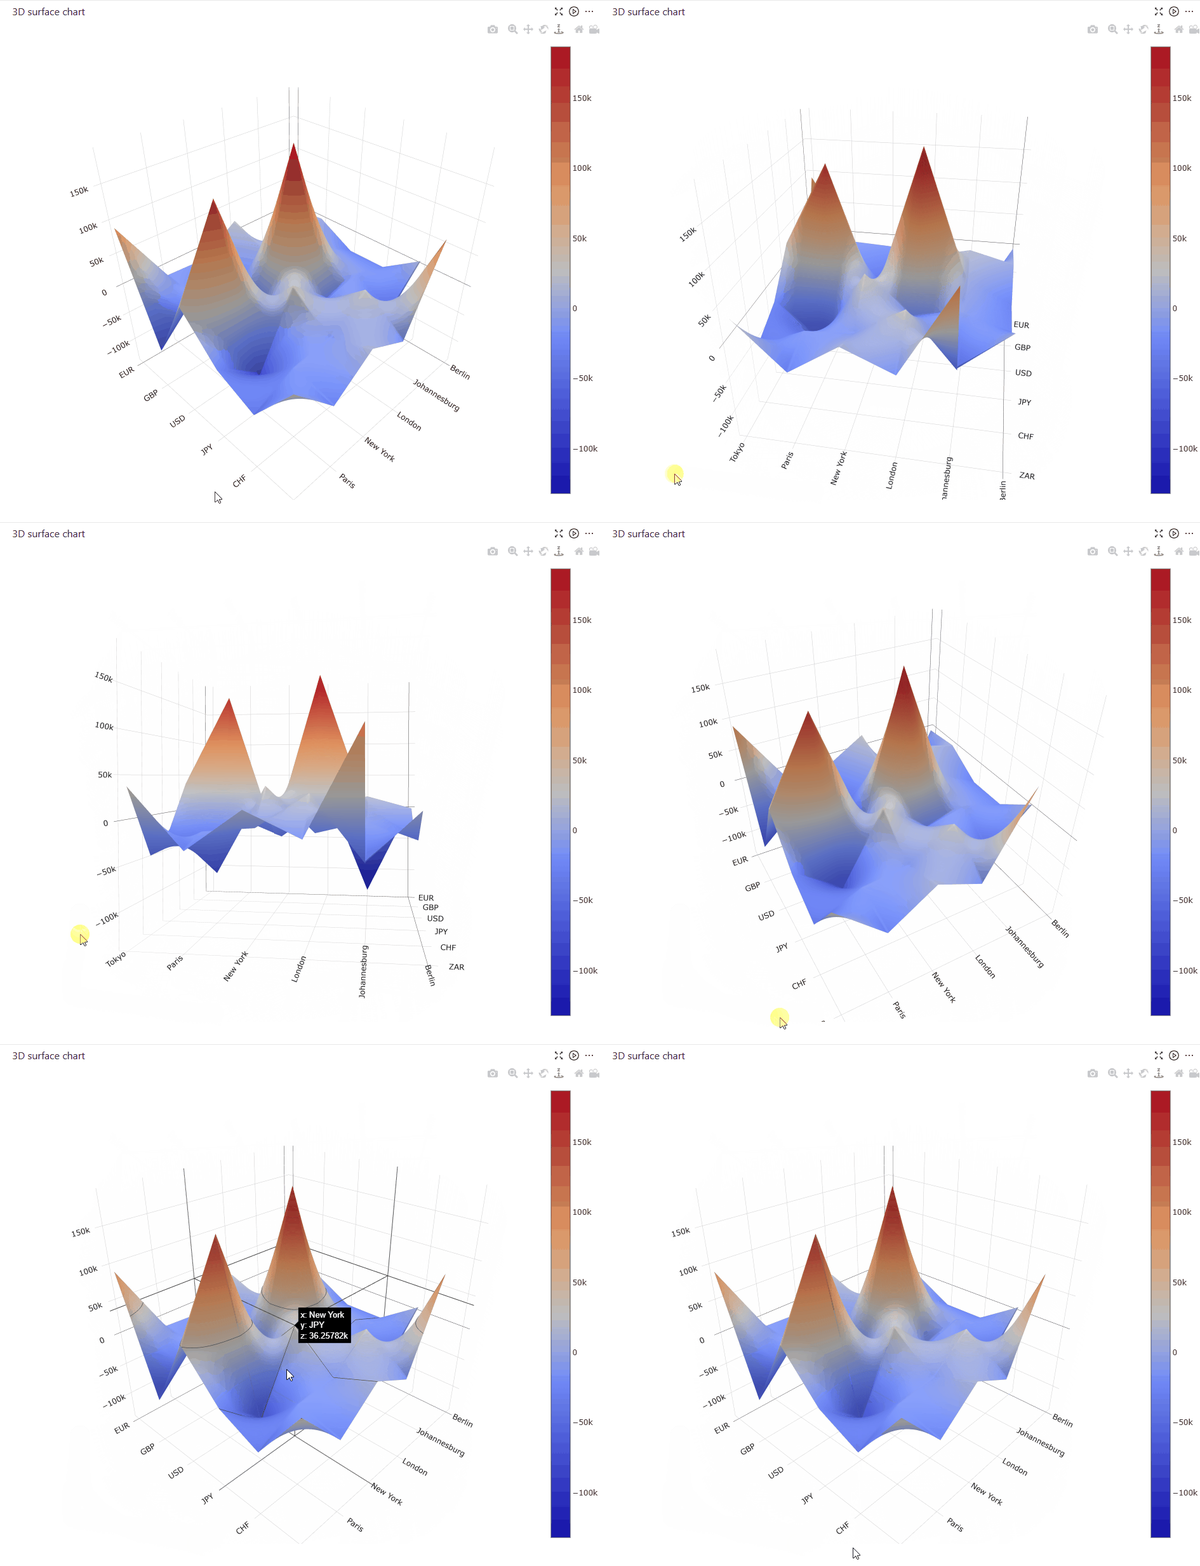
The 3D surface chart was added as a new widget. This widget will be especially useful for front office traders who would like to better visualize volatility surfaces.
Data labels on Pie charts and Donut charts
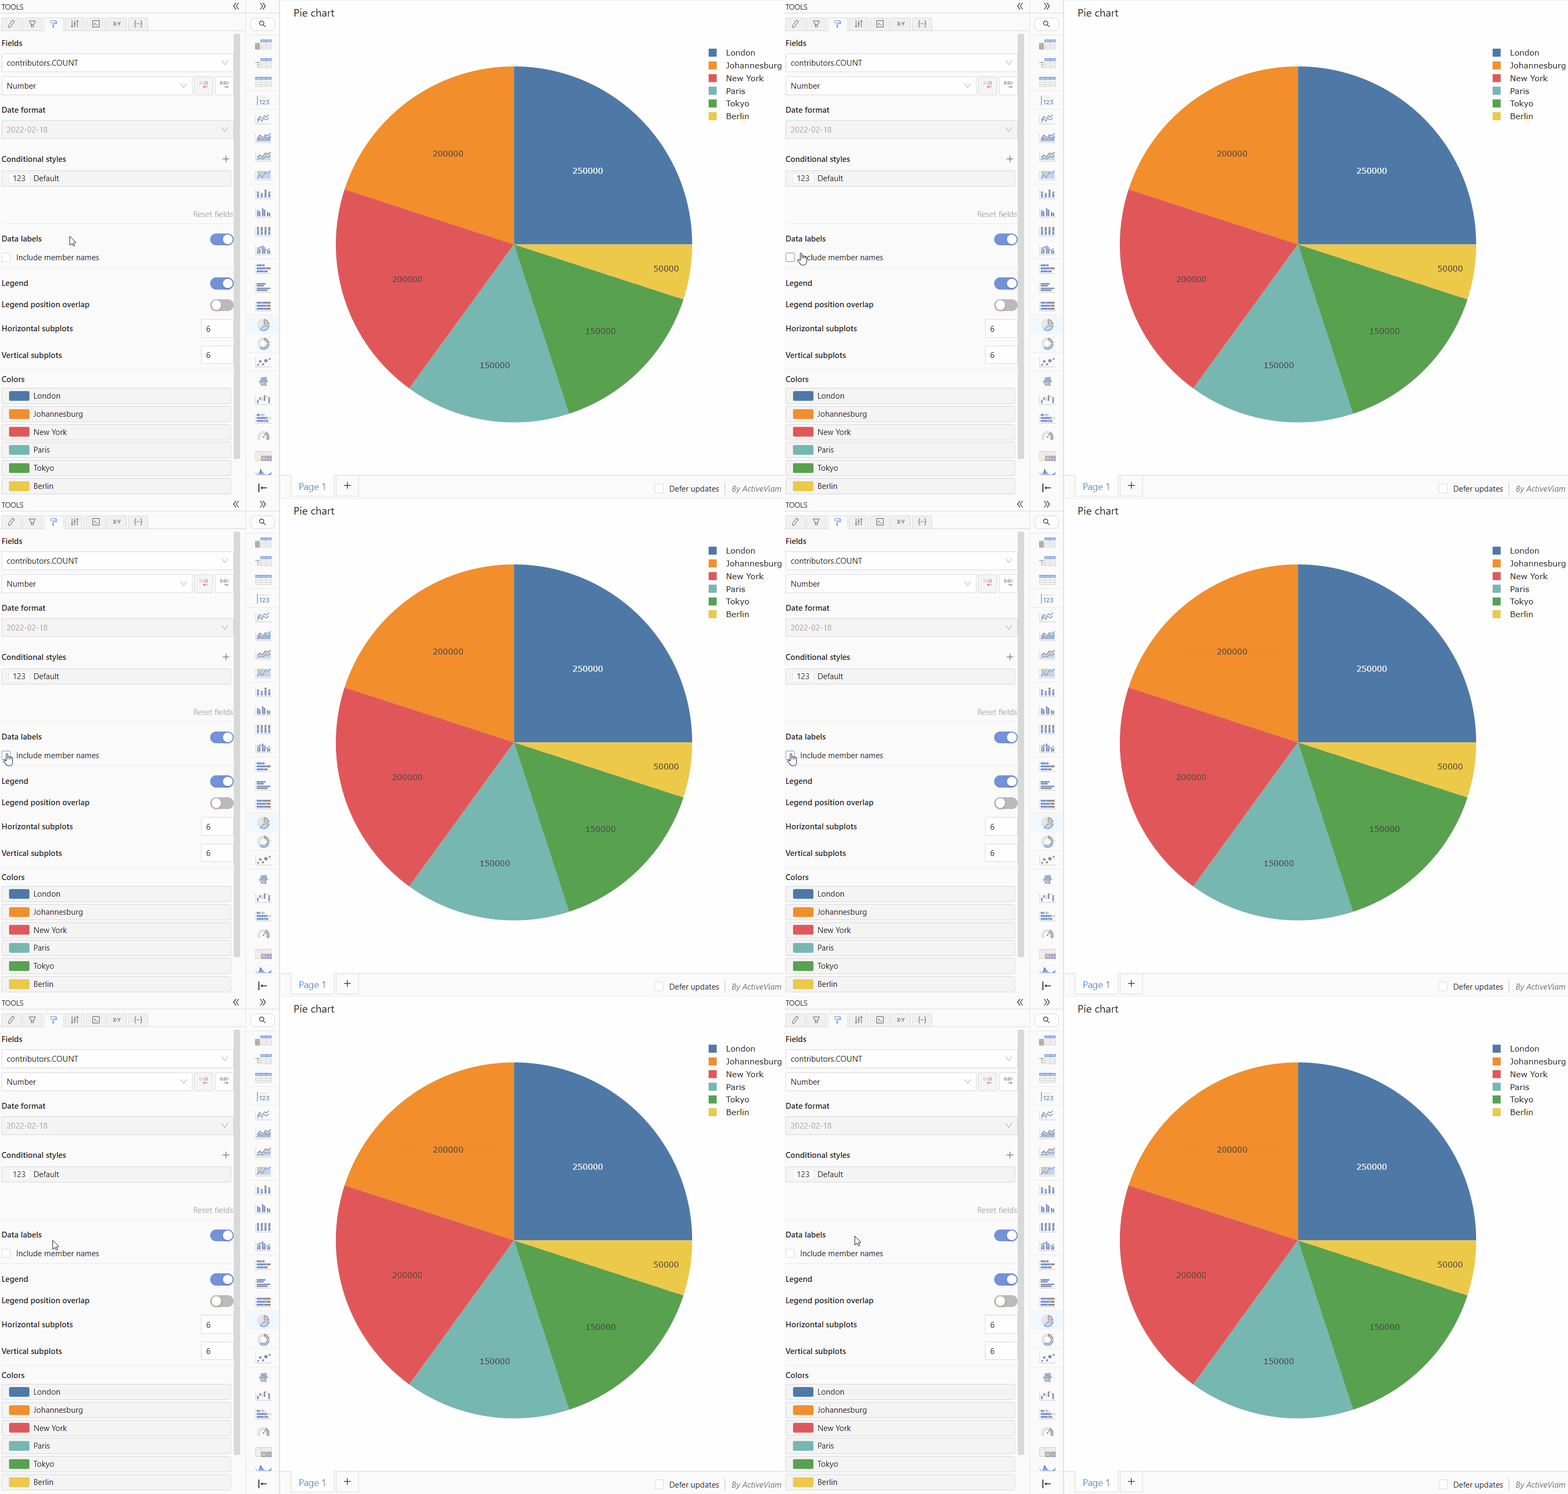
Pie chart and Donut chart data labels can be configured in the Style editor to show the member names directly on the slice. Combined with toggling the legend off, this can save space in your dashboard.
Single select filters
You can now choose to have your filters be either single or multi select. This feature is especially helpful when filtering on a hierarchy where it would not make sense to have multiple members selected.
Improvements
Investigations on grand totals
Investigations are added to grand total cells. This allows you to dig deeper into underlying data points of all cells, not just child members to have a greater overview of how certain data points are broken down.
Ampersands in MDX
Support for ampersand-quoted identifiers in MDX, e.g. [Geography].[City].&[Berlin]. This syntax is often used in Microsoft Excel when generating MDX.
5.2.5
2025-01-31
-
Ability to navigate the home page with the keyboard.
-
Buttons to open the context menu on dashboards and folders in the home page.
-
Ability to add KPIs to a calculated measure definition.
-
Ability to select search results using the ↑, ↓ and Enter keyboard keys, in the Filter on popup.
-
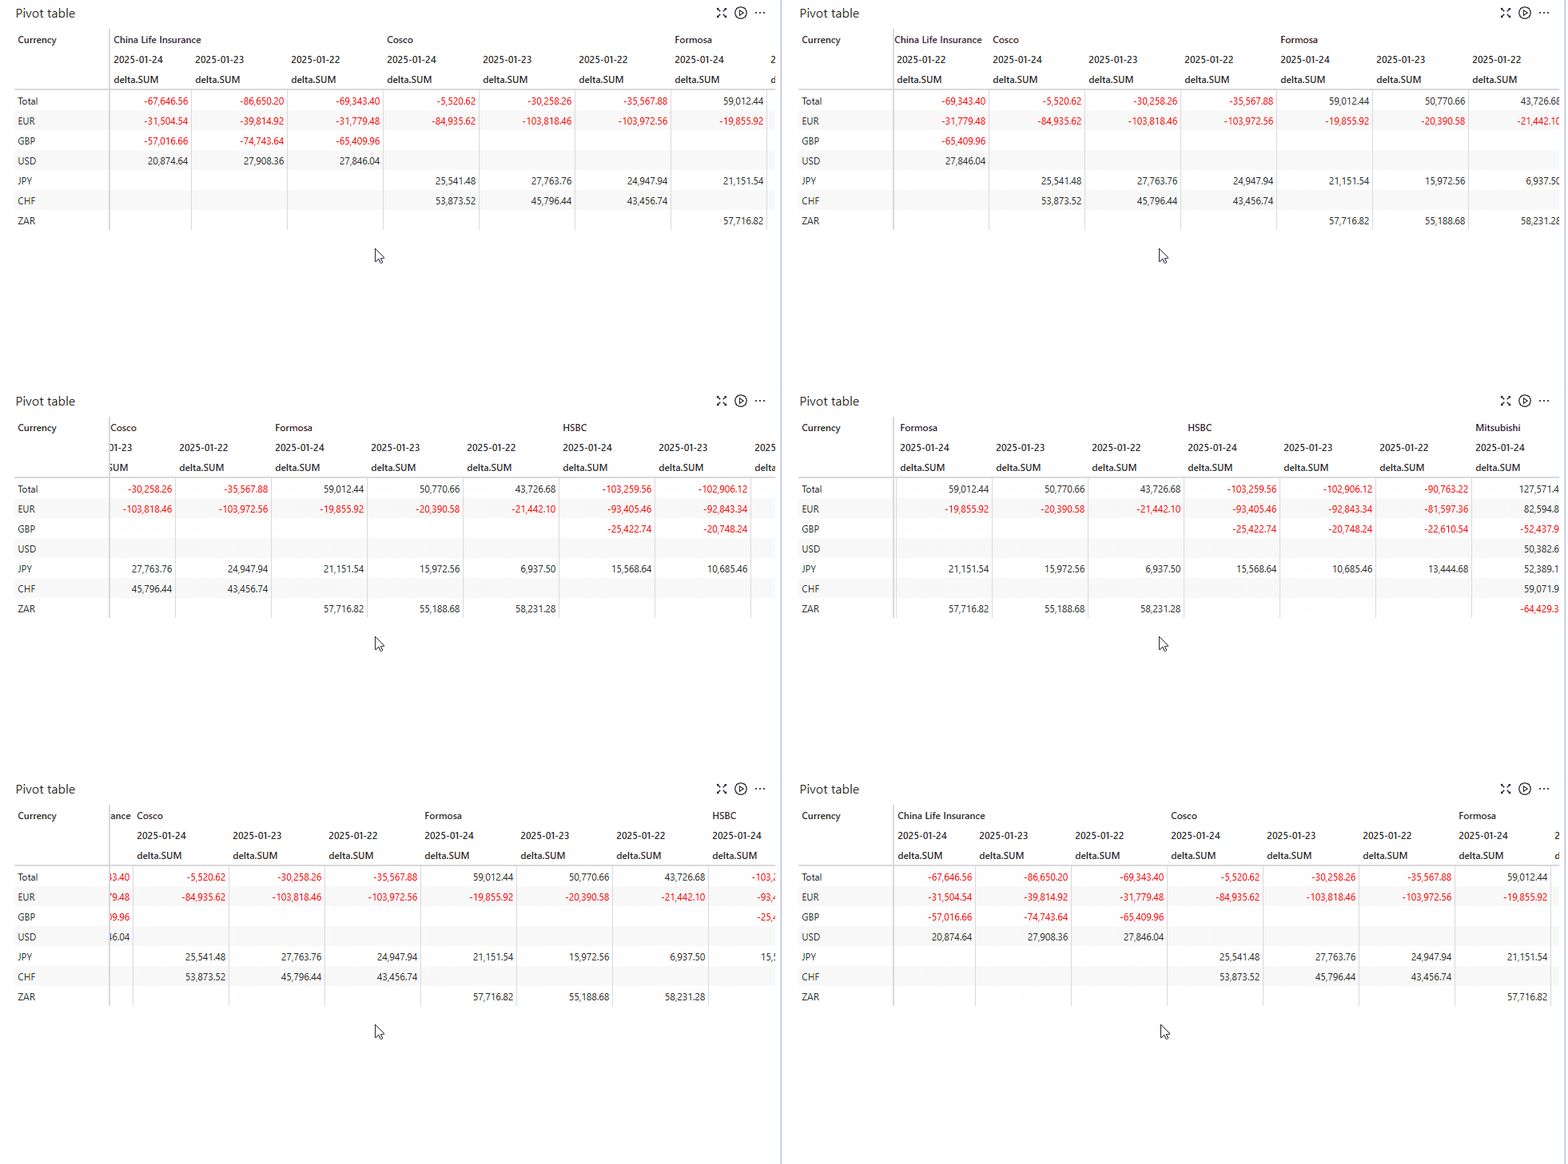
Improved sticky headers in tables
5.2.4
2025-01-03
-
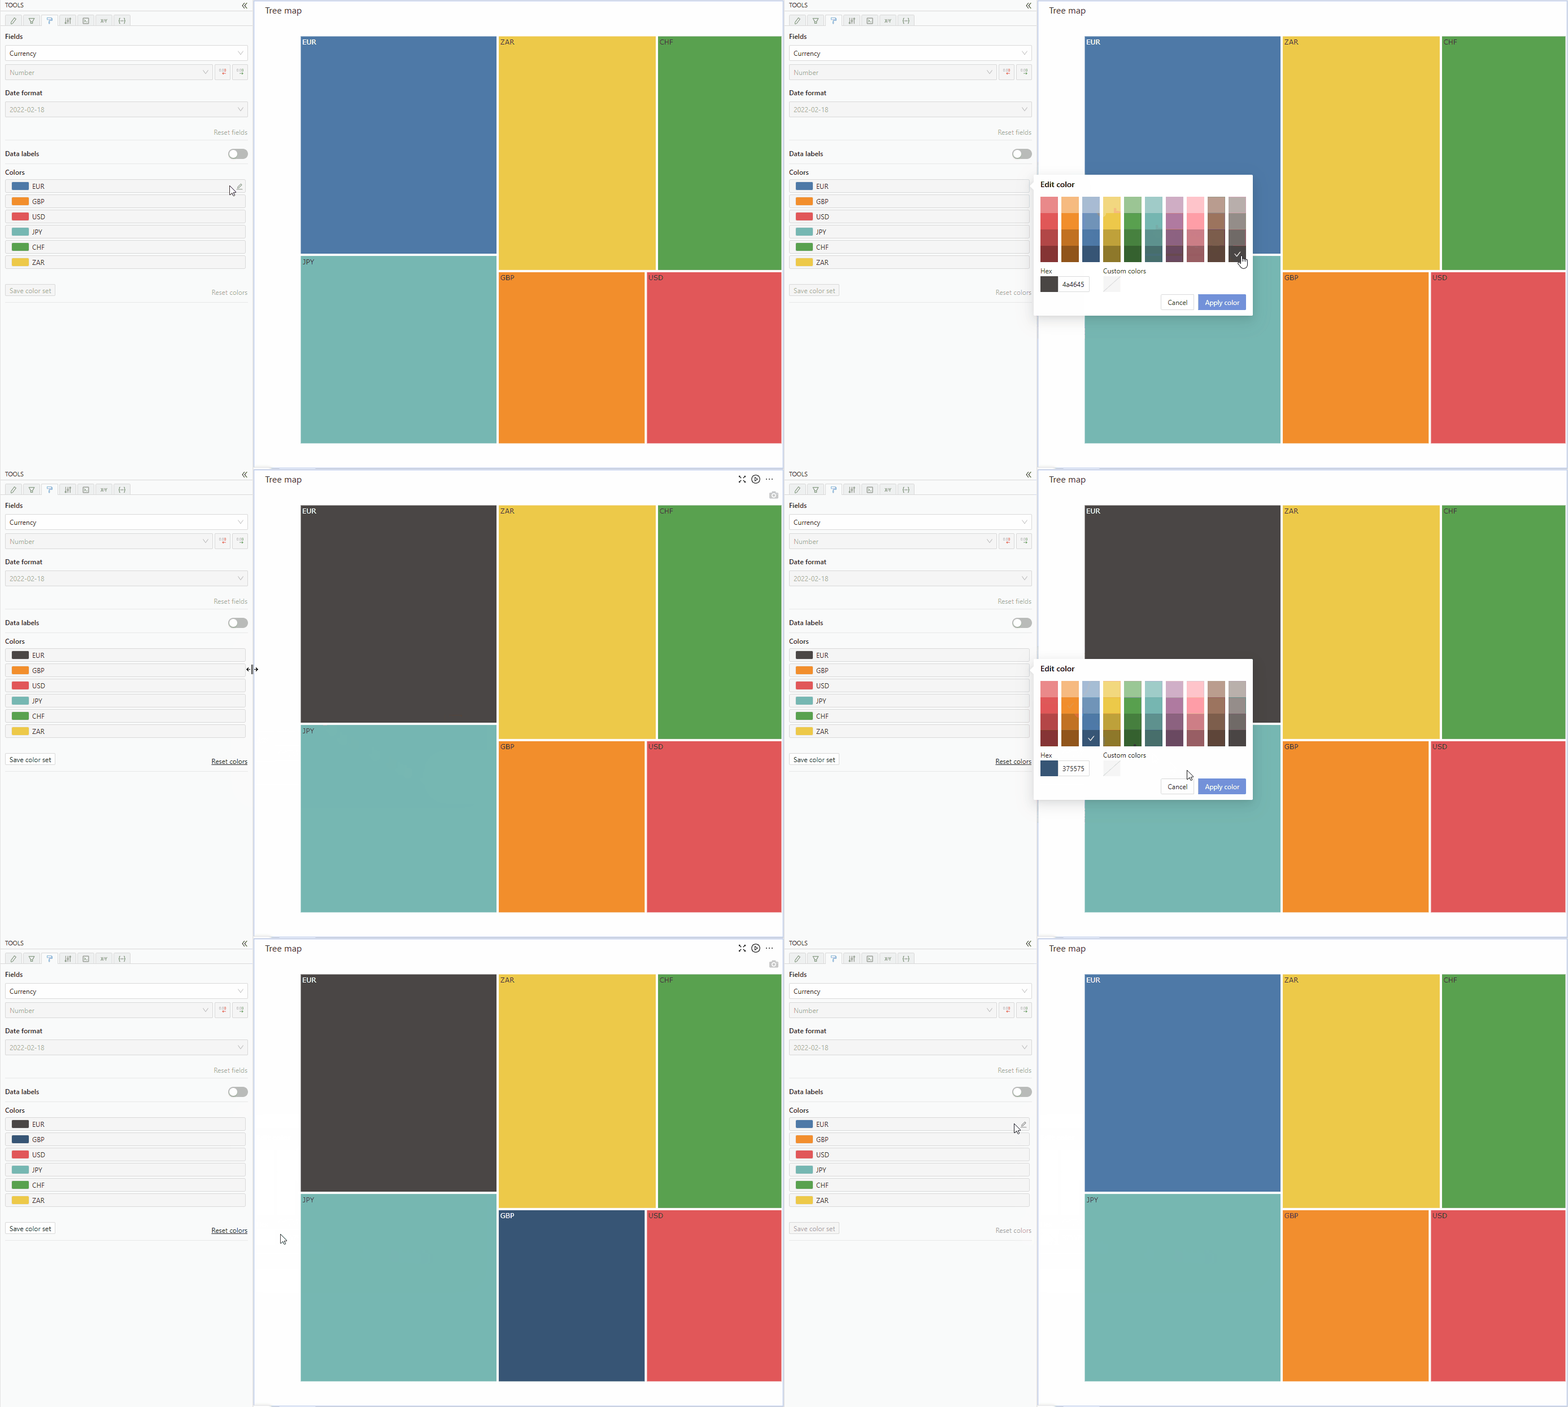
Ability to set colors on tree maps
5.2.3
2024-12-02
-
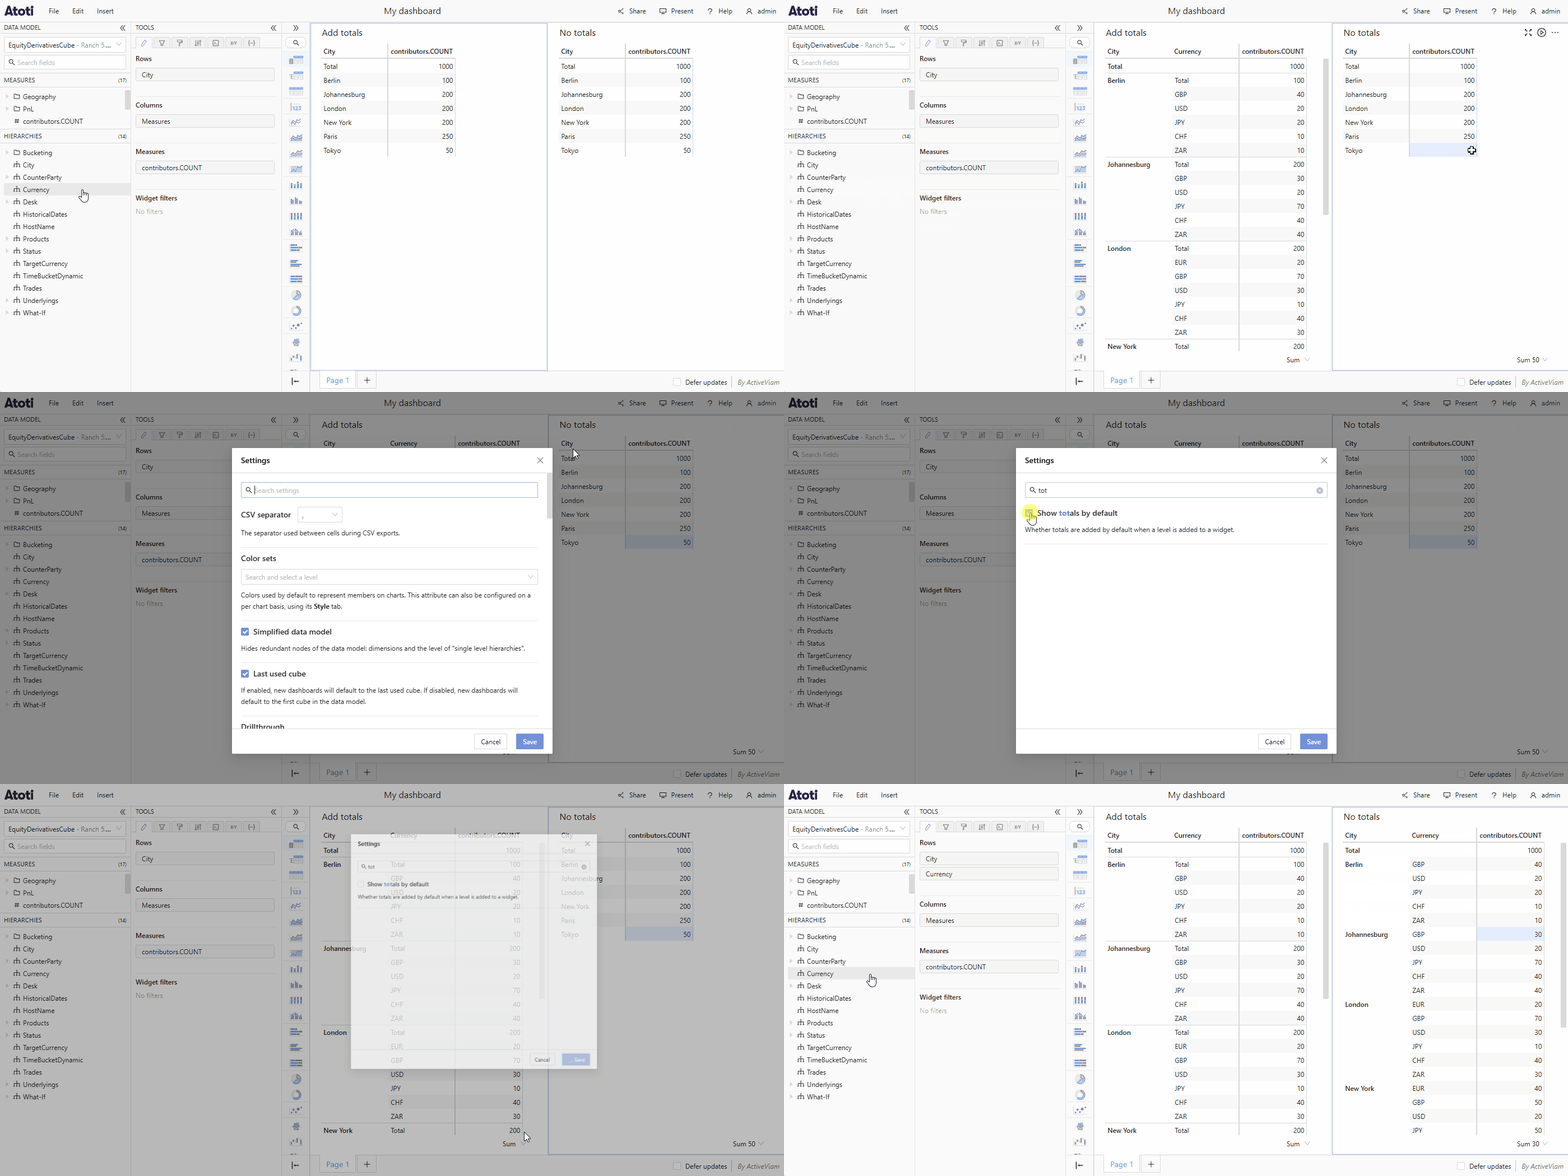
Setting to add totals by default
5.2.2
2024-10-31
-
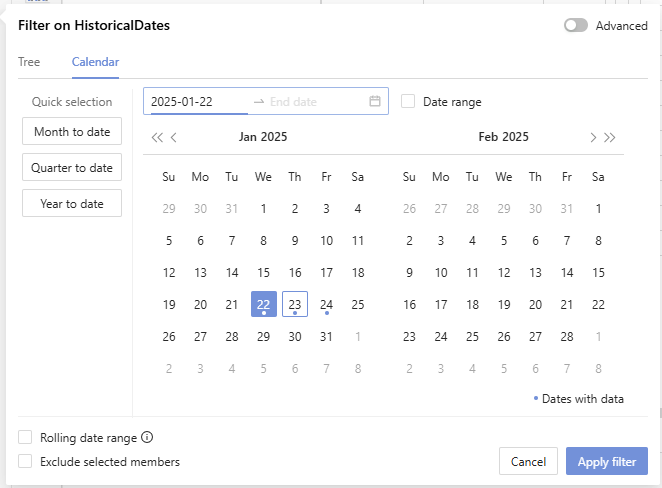
Dates in calendars are highlighted when the cube contains data for that date.
-
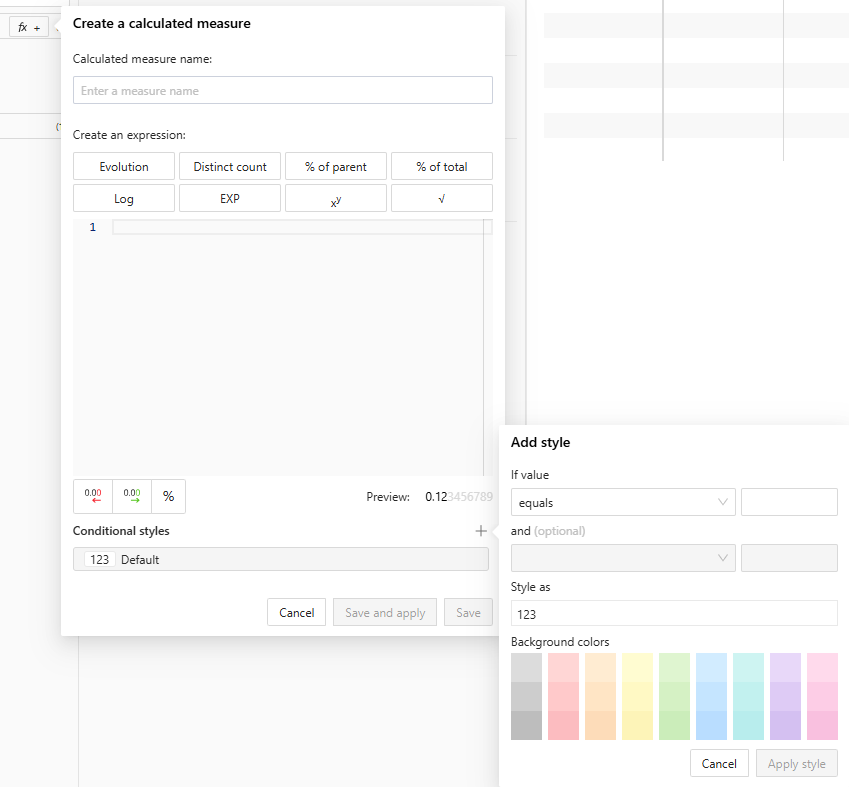
Save conditional style in a calculated measure
-
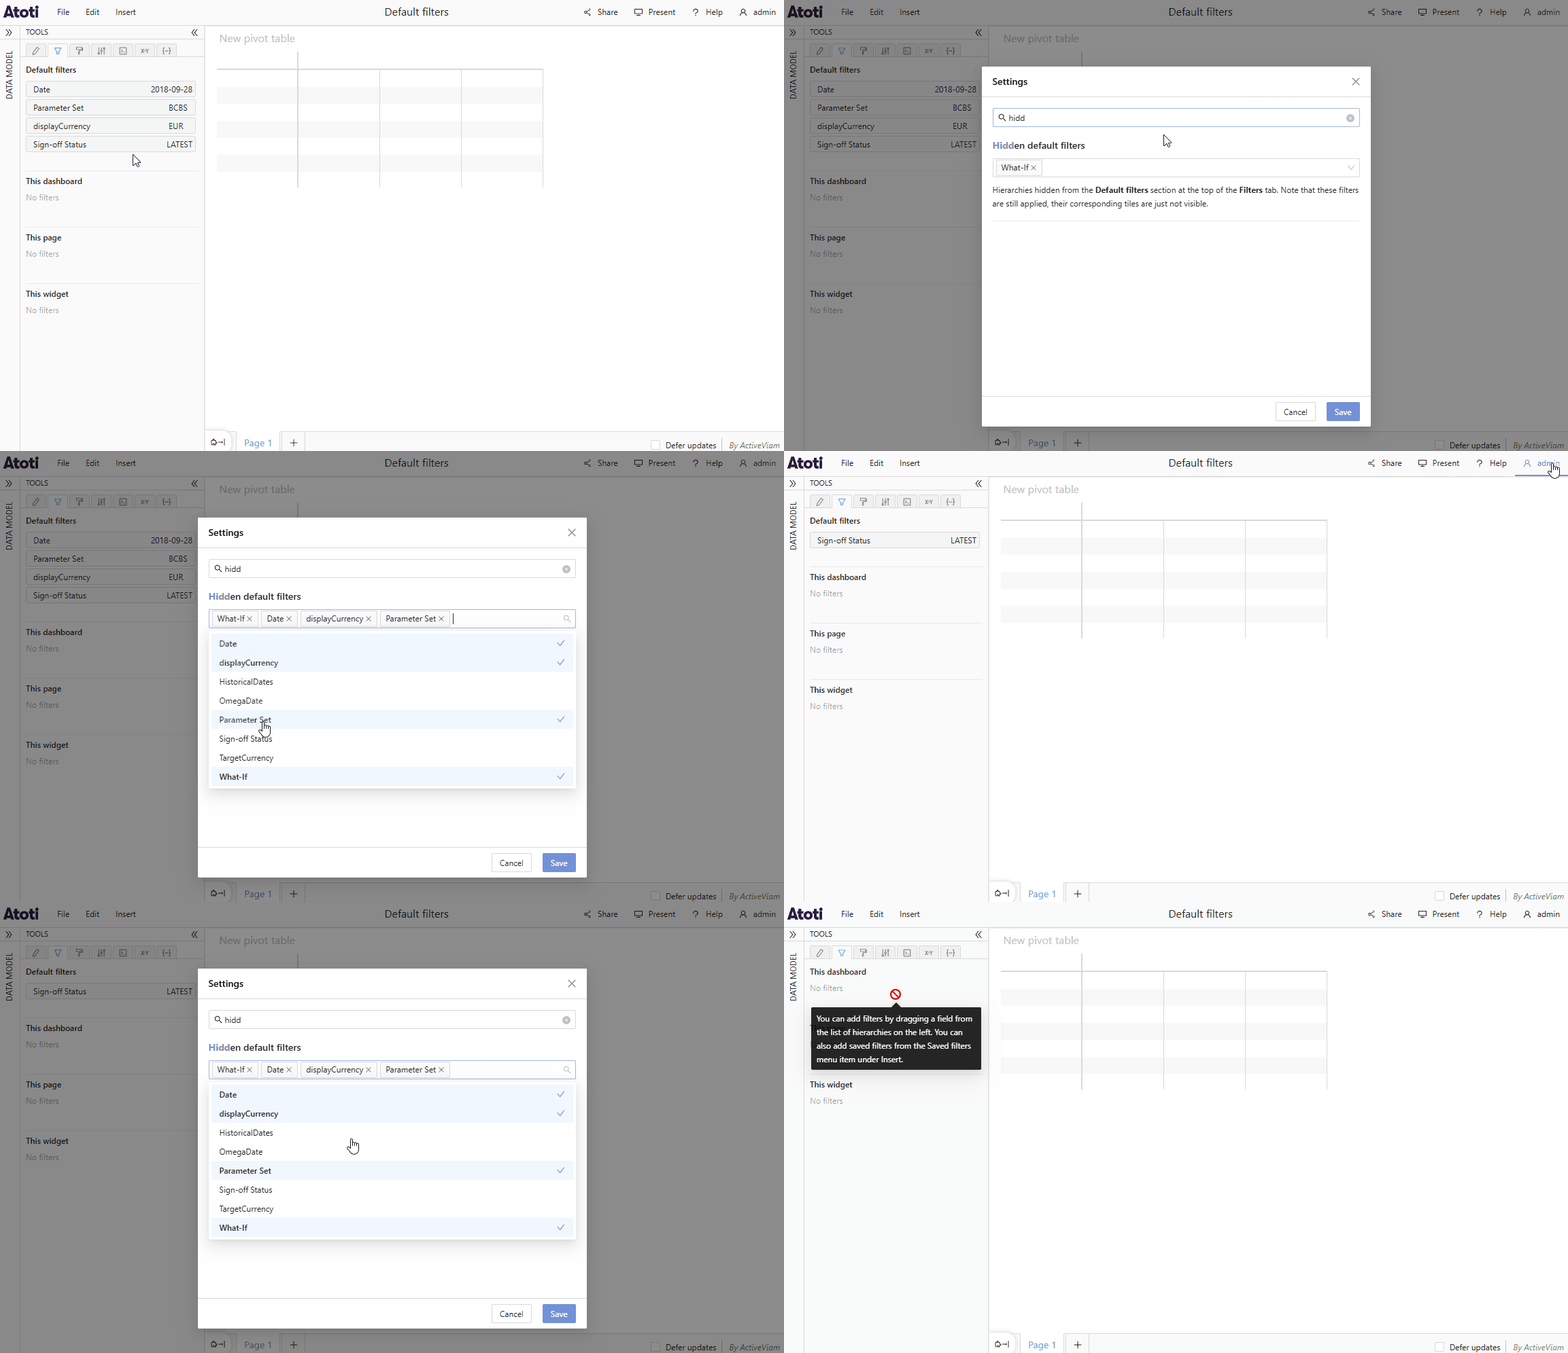
Hide default filters
-
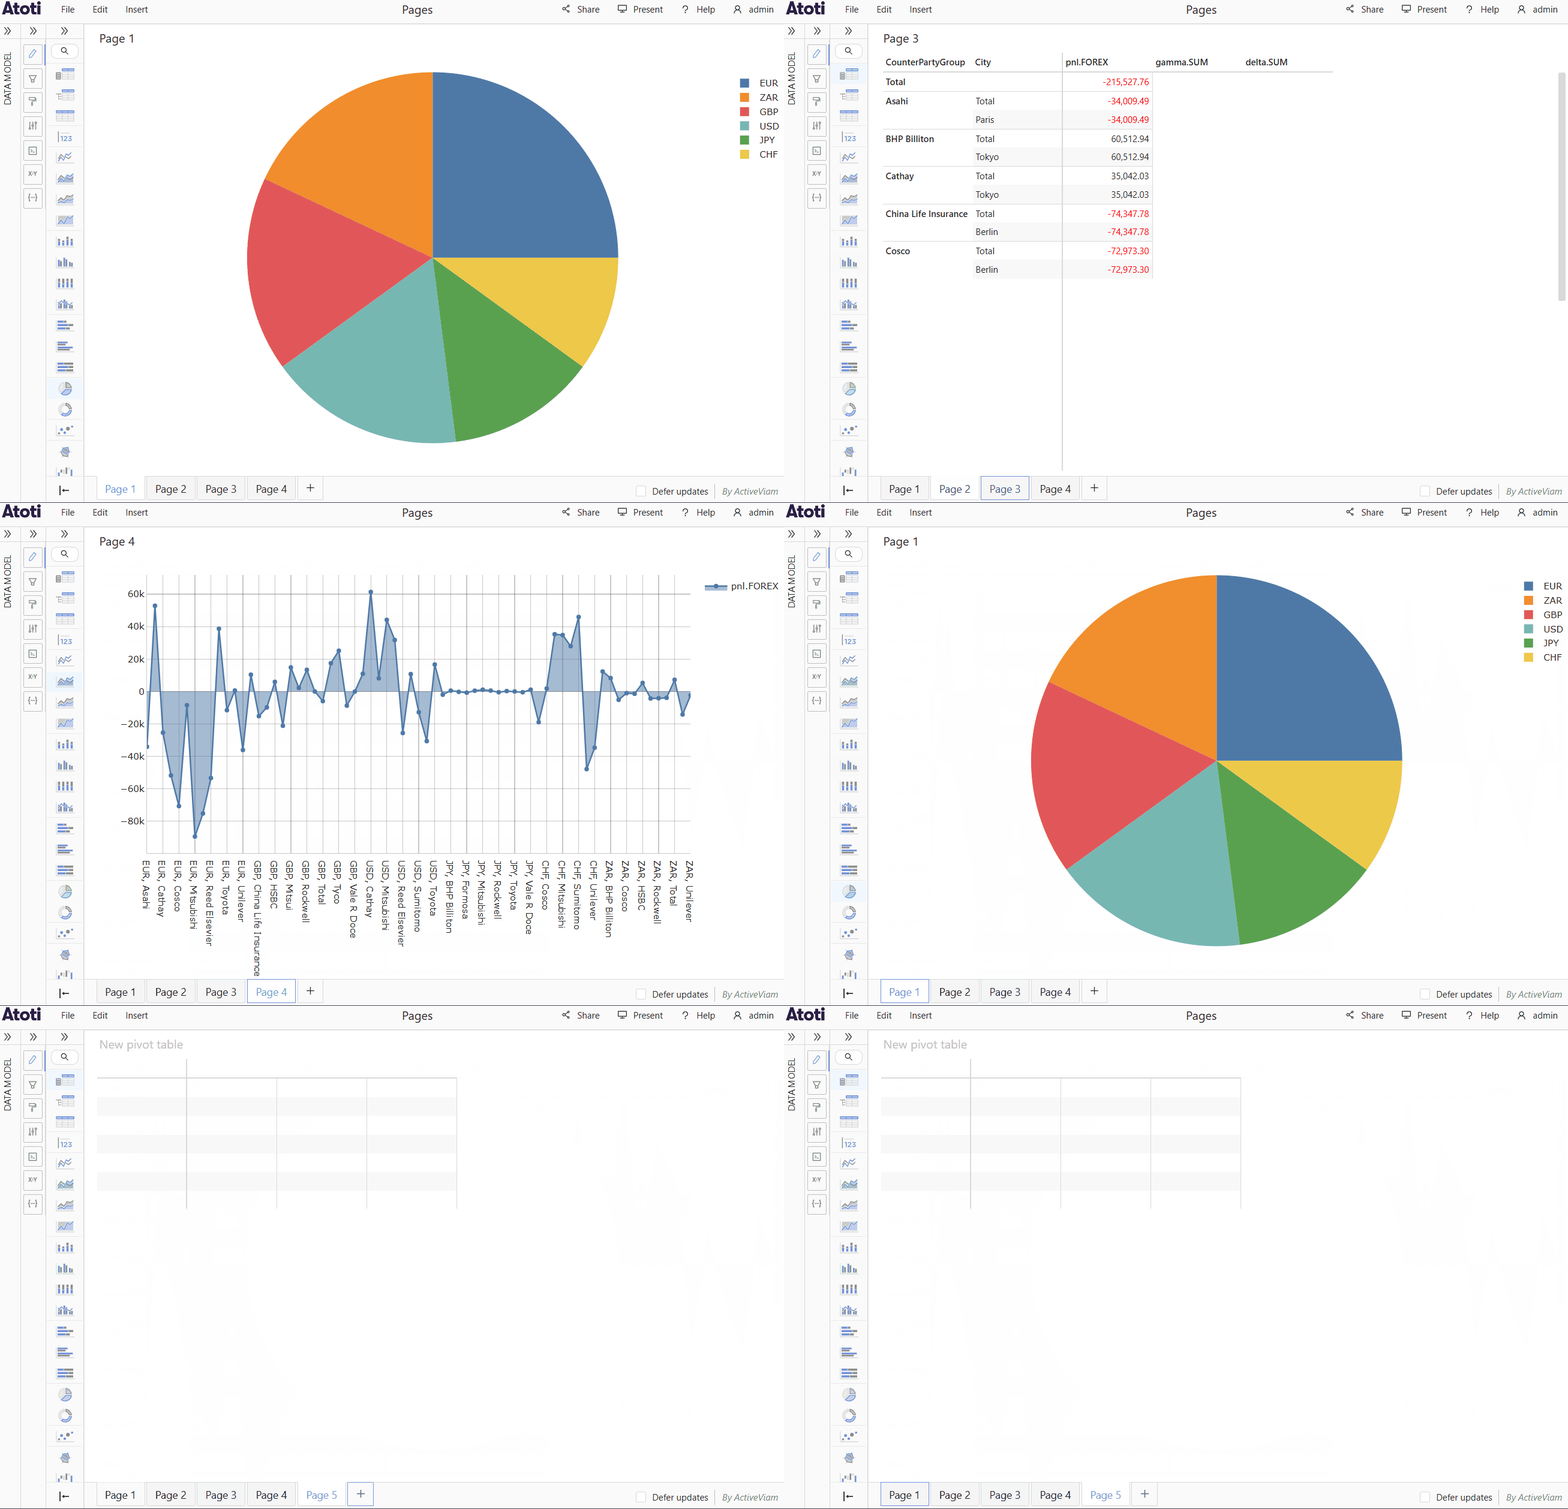
Navigate through dashboard pages using the keyboard
-
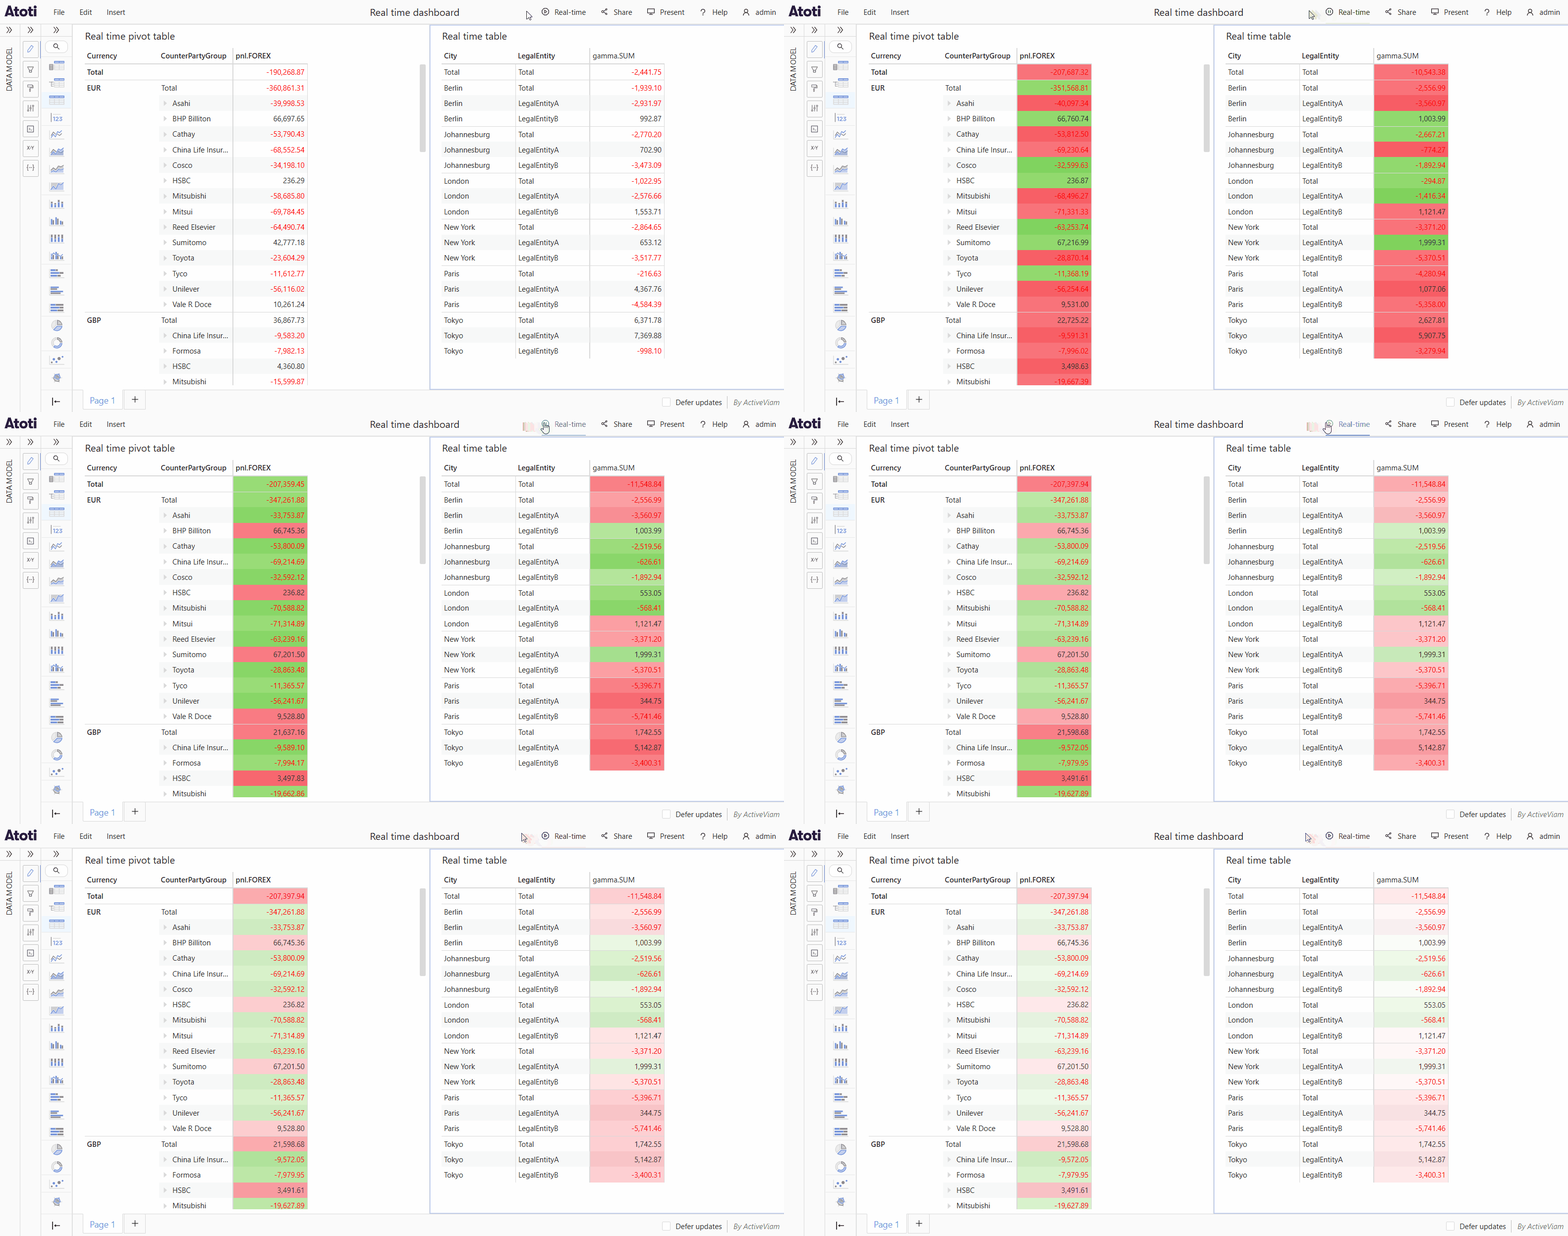
Real-time for entire dashboard
5.2.1
2024-09-30
-
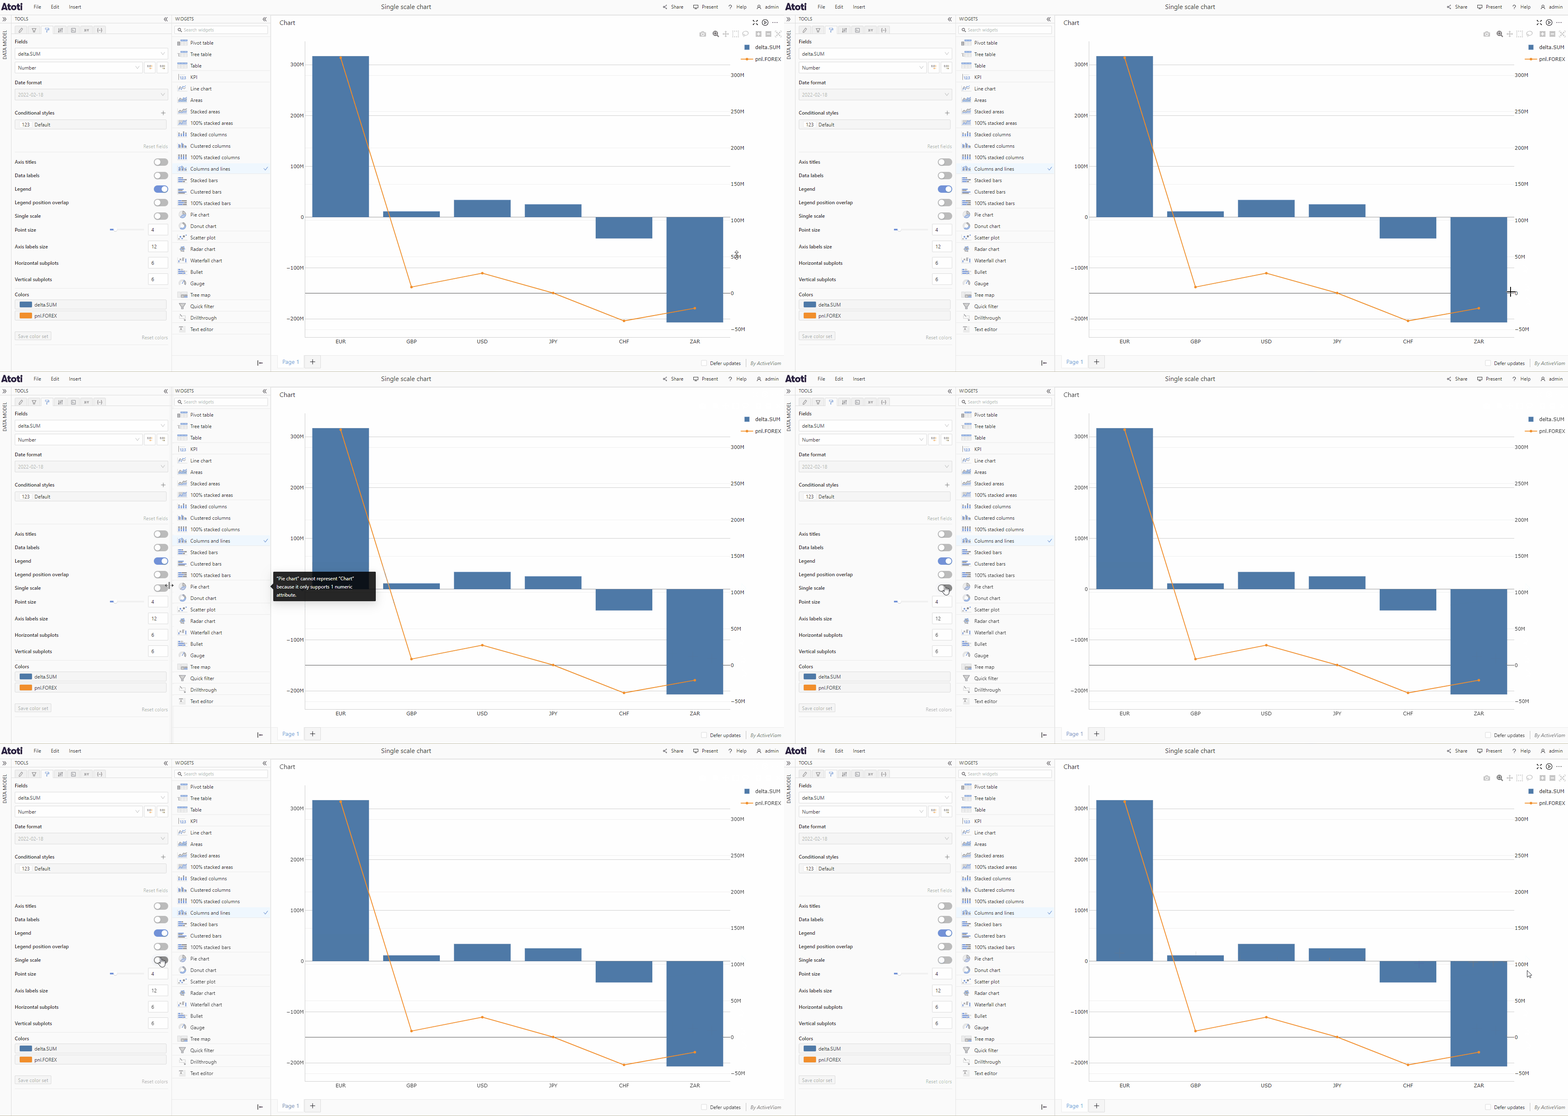
Toggle between single and double scales on charts
-
Hovering over a measure displays description
5.2.0
2024-08-30
-
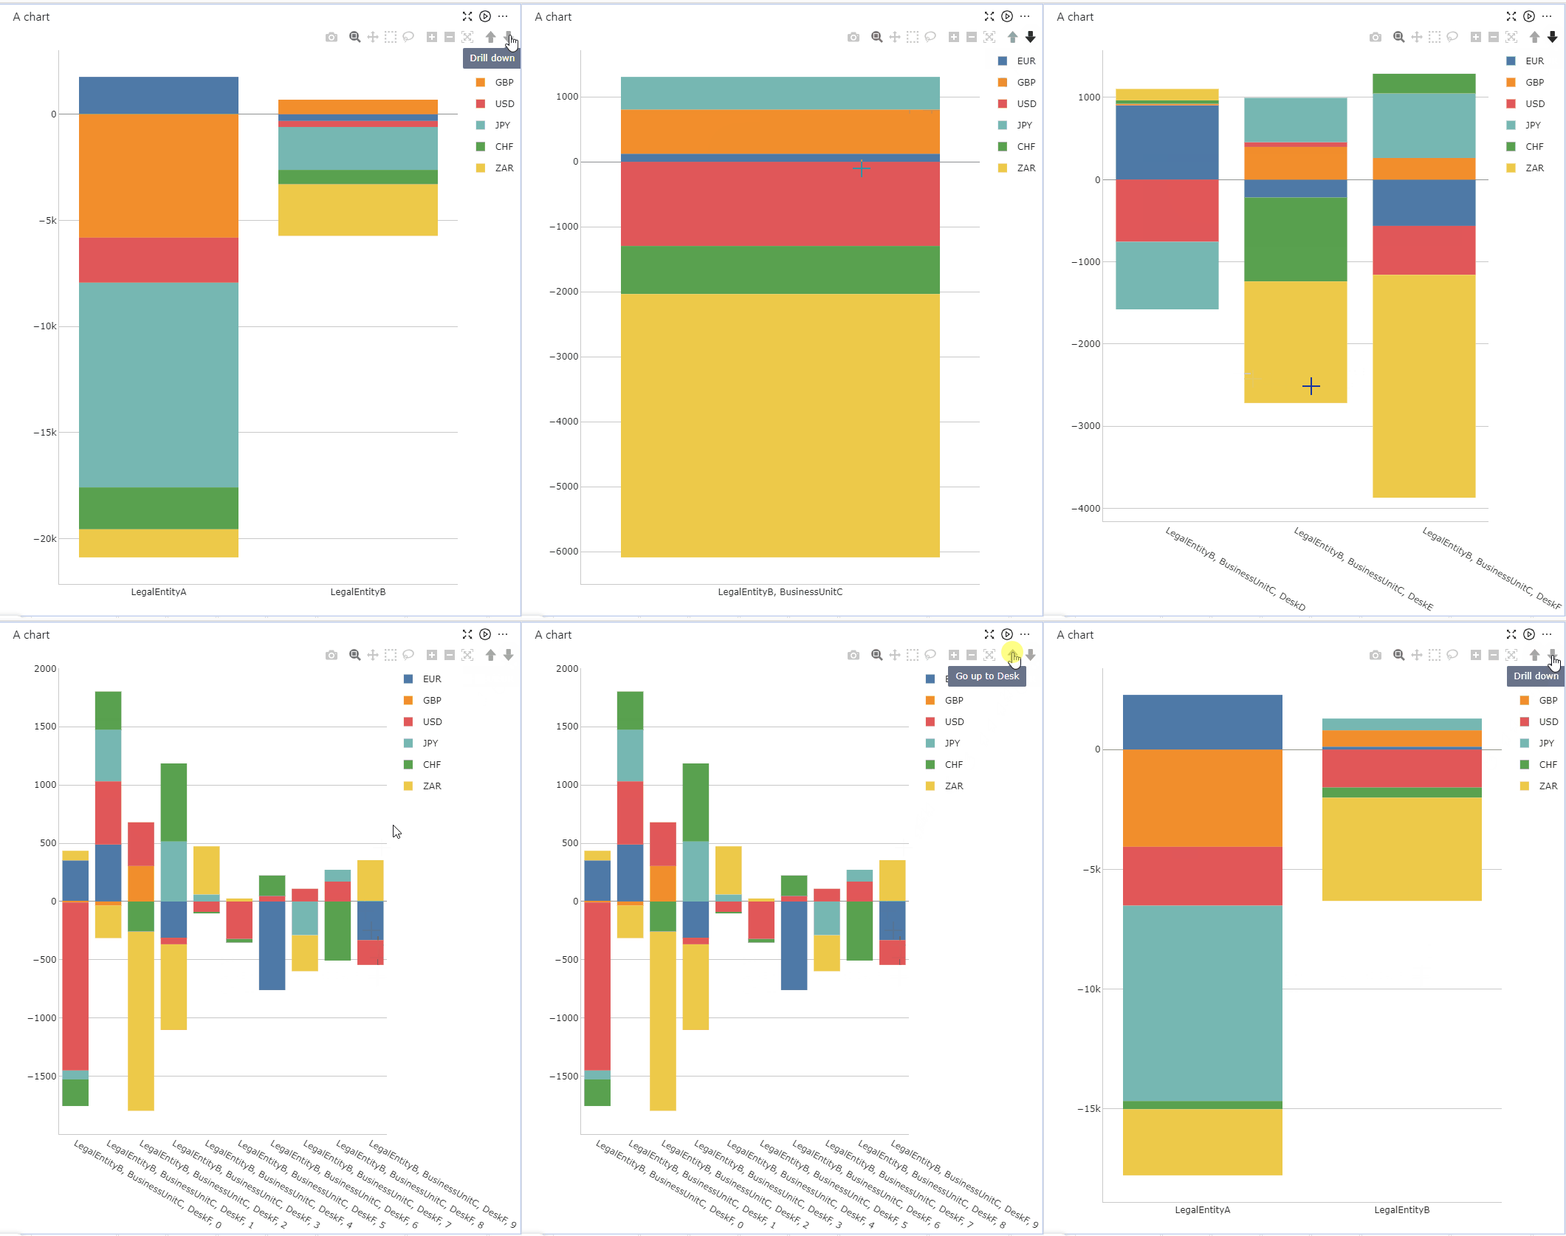
Drill down on charts
-
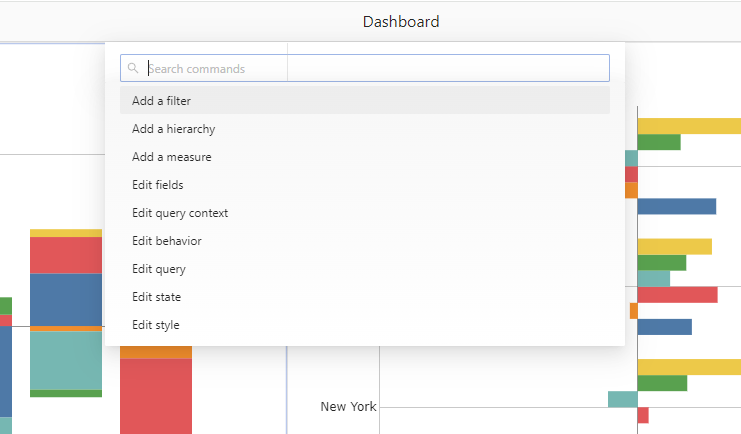
Command palette to quickly find actions
-
Save members colors